PENN trade ideas
PENN Back at previous highsPENN Back at previous highs
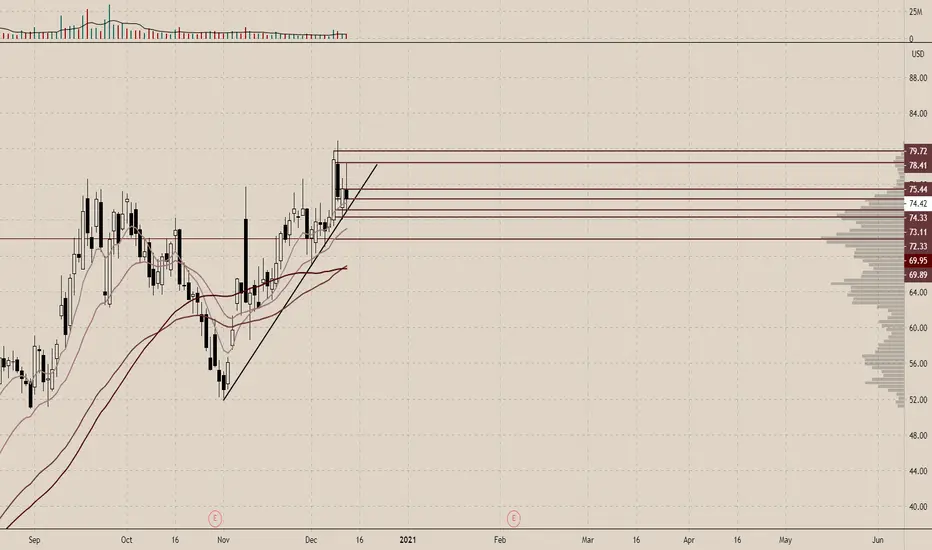
back to the previous tops
potential support
can drop to retest trend line support

PENN broke the box.Revisiting another trade setup that I posted a week ago. It has now broken the box. If you have not already entered from my original trade plan look to enter after price shows it will hold the top of the box and move up. Targets are the fib extension and risk is a close below the box. See previous post.

PENN BUY OR LONG , TARGET $100PENN confirmed pattern " SHS price increase ", target is pattern height, area: $100.
Penn buy : $78
Penn target : $100
Stop loss : 10%
Wish you a good deal!
Please note that I work mainly on twitter

RectanglePENN appears to be trading in a rather large rectangle channel....
A rectangle is usually a continuation pattern and Penn was in an uptrend before getting stuck inside this channel, but there is no way to know which way price will break...often these are periods of consolidation where the bulls and the bears are fighting against one another..
Price forms resistance at the top of the channle and support at the bottom of the channel. Rectangles can last several weeks to several months...other patterns can form inside of the rectangle...2 touches of each trendline, preferably 3 on one trendline and 2 on the other are required to have a valid pattern..
It is preferable for most traders to make a lot of money trading and not just making a lot of trades...Having a plan that you can hand to another trader and they can execute the same trade can help many...we need targets so we know when to get out and the security may go higher (or lower) than we anticipated....but sticking to your plan means you can accept the targets you "planned". Sometimes we have no control over what happens like overbought conditions etc...Leaving the market early with a profit surpasses leaving later with a loss (o:

PENN to retest the 50 day averagesBarring no stimulus is passed and the market doesn't crash then I see it bouncing somewhere between $65 - $66 with resistance at $68, 73, and $76 moving back up. A breakthrough would probably mean $85 as a first target.


PENN to $120. Penn National Gaming the most bullish chart. Penn National Gaming trading in a broadening bullish channel. NASDAQ:PENN

PENN on watchI like this consolidation at the high. Long above the box to extension targets. Risk is a close below box.

$PENN continuation #headandshoulders #chartPattern setupNice potential breakout setup to ATHs. Attaching chart pattern resistance early today.

PENN Calls Give 100% return!Nice day trade here taken with my community! we entered 15 minutes after market open and closed out in less than an hour for 100% Gains!

$PENN Bearish Swing Trade PlanGreen Line - Entry Target
Red Line - Exit Target
Pink Line - Stop-Loss
Highly suggest using Google to Search "Transparent Traders" if you're trying to get to the next level.
Transparent Traders exists to solve the critical issues facing our traders, both large and small. Our unique approach is not only what differentiates us, but also what makes us successful.
Our advanced Blackbox uses custom algorithms & predictive A.I. to locate the most accurate day or swing trades for the best chance of success.

big move at the break of penn cylinderitll be interesting. cylinder is a little steep so im leaning towards the bearish side, but if it breaks up from it, this thing'll rip

PENN National GamingBeen relooking at more stocks with log scale and seeing if I can get a clearer count from it. PENN has promise and can see $100+ to finish this larger wave 1. Wave 4 not confirmed yet, but possible bottom has formed. More bullish over $68. Over ~77 to confirm wave 4 is in. Can see possibility of correcting to ~$45 - $34 for wave 4 which would be a great buying opportunity.

Can continue uptrendThis name is dependent on COVID news but has gotten back into formation and can make another big move up .

Will Covid Kill PENN's Rally? I think soU.S. just hit 160K new covid cases and there's no sign of slowing down. In fact, it's exponential growth (more than 100%) in November alone. That alone should cause the rally to pause and retreat to support, but the economic data has been promising and DKNG's just raised their guidance with one caveat - "As long as there are no disruptions to sports due to Covid". That being said we've already seen a number of games rescheduled in the NFL and what would happen if the playoffs were to be canceled? Or the season is postponed... until when? Spring?
Things to consider in the weeks ahead...
1. Exponential Covid Case Growth and Overrun Hospitals nationwide.
2. Covid has already disrupted the NFL, College Football, etc.
3. Thanksgiving may be a super spreader event which dramatically accelerates us to 250K plus new cases daily
4. Black Friday shopping? That'll be worse than Thanksgiving
5. It's going to be a long winter and we're just getting started
If sports make it through November then it could be smooth sailing from here - maintaining the blue line support. However, if $H%T hits the fan look for support at the redline. At these levels, I'm bearish but it's close to a breakout so who knows.


Cup and HandleSmall Rising wedge that developed longer than 3 weeks ago. A RW time frame for forming is 3 weeks or more, otherwise it is a pennant
PENN has dipped down and out of the RW. Perhaps a done deal?
Be safe
Not a recommendation


PENN BreakdownPENN looking like it topped and formed a double top on the way down. I am expecting this to have a relief bounce next week, before getting soundly rejected and breaking down further.
Price expectation is the start of the breakout (in red) if the orange line does not hold.
Previous idea on the breakout:


