Overlap among PFF, PFFD, PGX, PGF and CWBPFF is an exchange-traded fund (ETF) that invests preferred stocks (fixed-rate, floating-rate, and convertible).
PFFD is similar to PFF, but the number of holdings of PFFD is almost half compared to PFF. The expense ratio of PFFD is also about half of PFF.
PGX is an ETF that invests fixed-rate preferred stocks.
PGF is an ETF that invests fixed-rate preferred stocks of financial institutions.
CWB is an ETF that invests convertible bonds as well as convertible preferred stocks.
So, the coverage of the ETFs above overlaps each other.
The lists of holdings can be downloaded from the official webpages of the ETF providers, and they have identifiers (SEDOL or ISIN) for each constituent. I counted the constituents that both ETFs held based on the identifiers. The result is as follows.
96% of the holdings in PGF are also included in PGX. (It consists of 55% of PGX.)
96% of the holdings in PGX are also included in PFF. (It consists of 57% of PFF.)
99% of the holdings in PFFD are also included in PFF. (It consists of 67% of PFF.)
19% of the holdings in CWB are also included in PFF. (It consists of 23% of PFF.)
10% of the holdings in CWB are also included in PFFD. (It consists of 18% of PFFD.)
There is no overlap between CWB and PGX, and between CWB and PGF.
The data are as of the end of September 2021. The percentages above are weight. (Based on market value, not number of constituents.)
The chart above shows the relationship among PGF, PGX, PFF and CWB. (PFFD is excluded for simplification.)
Roughly speaking, PGF is a subset of PGX.
PGX is a subset of PFF.
PFFD is a small copy of PFF.
PFF is the broadest coverage compared with PFFD, PGX and PGF.
PGF and PGX don’t hold convertible preferred stocks, but PFFD, PFF and CWB do.
The significant overlap among the preferred stock ETFs (PGF, PGX, PFFD and PFF) leads to similar price movement among them.
In my view, holding PGF, PGX, PFFD as well as PFF doesn’t diversify your portfolio. Rather, it means a concentration to the fixed-rate preferred stocks of financial institutions.
Holding PFF only is enough.
The overlap between PFF and CWB is slight. The price movement is different. Holding both PFF and CWB is reasonable for diversification.
As I’m a non-native English speaker, this idea may contain some strange wordings. Nevertheless, thanks for reading.
PFF trade ideas

Preferreds set to move lower$PFF - Preferred stocks have reached a critical maximum for now and with today's price action we may see an additional confirmation to RSI an MACD. RSI has already dipped for a sell signal and MACD is showing a strong divergence with the price. Volume activity is showing as well that buying power is slowing down. If we have a bullish engulfing candle today as a close that will be a strong confirmation.

PFF 2020-11-16TICKER : PFF
DATE : 16/11/2020
PRICE : $37,71
TRANSACTION : $94 286 000,00
AVERAGE TRANSACTION : $7 760 690,29
MAX : $94 286 000,00
% OF MAX : 100,00%
DIFFERENCE FROM MAX : 1214,92%

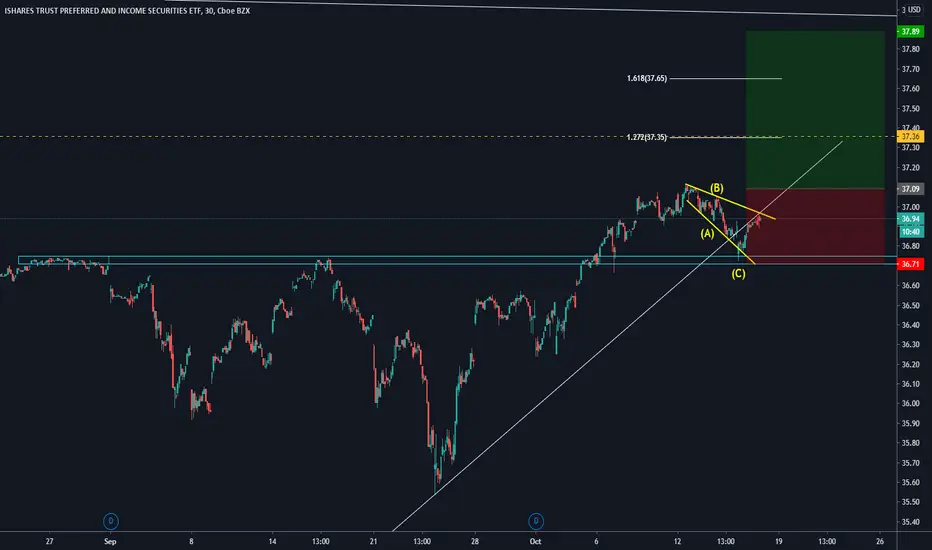
Our Stock of the Day / PFFToday, we have a long trade to share on this ETF. Here is the full explanation
a) The price is above a major Support zone that was resistance before
b) We can see a clear ABC pattern (continuation structure above the Support and on the edge of the ascending trendline)
c) Based on these 3 items, 1) Corrective structure b) Supported on a Major level c) The price is on the edge of the ascending trendline. We will develop a long setup
d) The entry Stop and Take profit are the ones you can observe on the chart
e) Our Break Even level is the yellow line
f) Here, we will take a 1% risk of our capital
g) If the price goes below C, we will cancel the setup
h) Remember: Trade Safe, protect your capital, and always understand what you are doing.
PFF - My personal emotional rollercoaster Hope you learn from my emotional rollercoaster. PFF is supposed to be a stable monthly income play. In fact, some financial advisors treat it as cash/savings account. I was looking to park a large chunk of cash using this instrument in hopes to get a better yield than 1.5% I get from my savings account. Thankfully, I was scaling into the position which I got washed out of. If I would have started the monthly contribution process a year ago, I would be shitting lava bricks today. The kind of drops in such instruments make you believe something is *extremely* broken. Be VERY VERY careful out there in deploying your hard earned cash to use. Those profits you don't have are not worth losing what you do have!

PFF buy the dip with a sugar spoonHaving a hard time with ideas to get long as the market sells off. TLT doesn't seem to play well but the preferreds (mostly bank stocks) are down nicely. I like the yield and I like that preferred means they may not gut the dividend like all the other "so-called" safe names i.e. COP, GE, KMI . I have had some trouble trading bond products so I am just selling 3 A.T.M. puts in January for .30 to initiate a long position with a better price entry. Wish me luck

Long On PFFThis instrument has been trading in a very stable range, more stable than treasuries and similarly to TIPS. The dividend yield on this is 5%+.
This is a great way to diversify exposure to US-assets while assuring a high and reliable return.
If prices drop to 37.10, I'll be buying with very little hesitation.

Long on PFFThis instrument has been trading in a range much more stable than treasuries and almost comparable if not better than TIPS, but, the dividend rate is about 5%+
If the price drops down to 37.10, this is an incredible buy opportunity for long-term hold and great way to diversify within US assets.
I'll be buying with very little hesitation.

PFF overbought going into Fed MeetingPFF is a dogshit, overvalued, poorly managed, preferred stock fund. People have been buying it up going into an obvious rate hike on June 13th... Something like a 12 day winning streak.. Y'all know this is fixed income, right? Bagholders about to get dicked on. Lucky for y'all this is fixed income, and volatility is minimal

Example of a Downtrend Parallel Channel on PFFPFF formed a downtrend parallel channel.
A downtrend parallel channel (bearish channel) is a continuation pattern that slopes down and is bound by an upper and lower trend line.
The upper downtrend line it is called main line and marks resistance and the lower downtrend line it is called channel line and marks support.
For a bearish channel, the main line extends down and at least two bounces highs are required to draw it.
To draw a channel line ideally needs two bounces lows, however, some traders draw it using only one bounce low.
In a bearish channel the target is to short when prices reach main line resistance and take profit when prices reach channel line support, then, wait for prices to reach resistance again and repeat.
