PLTR Trade Update – July 11, 2025📅
PLTR held the breakout like a champ. ✅ After a clean move through the triangle resistance yesterday, today’s price action continues to build strength above $142.50.
🔼 Bulls are in control, riding the momentum with higher lows and tight consolidation near breakout levels.
🎯 Targets remain firm at $144.05 and $146.04.
🛡️ Stop-loss still protected below $139.76 — trade remains active and technically strong.
The structure is bullish, volume supports the trend, and PLTR could be gearing up for the next leg higher. Watching closely for a push into resistance zones.
🔍 Strategy: Breakout Continuation
📊 Sentiment: Bullish & Confident
💡 Holding long — eyes on the volume and breakout follow-through.
PLTR trade ideas

GEX-Based Options Sentiment GEX-Based Options Sentiment (as of July 7)
* Current Price: $138.69
* Highest Gamma Resistance (Call Wall): $139 → heavy OI + positive NetGEX → magnet + possible rejection
* Next Call Walls:
* $142 (GEX7, 51%)
* $144–146 stacked (GEX8–10) — breakout potential zone if $139 clears
* Put Wall + Support Stack:
* $131 (HVL for 7/11 expiry)
* $128, $127 → deep support zones
* Net GEX Bias: Mildly bullish short-term
* IVR / IVX:
* IVR = 38.5 (low)
* IVX = 64.7 avg
* Flow Tilt: 40.4% CALLs → Balanced, but leaning risk-on
📌 Option Trade Thoughts:
If PLTR clears and holds above $139, expect potential squeeze toward $142–$144 zone. Good setup for short-dated directional calls (0DTE or 2DTE) targeting $140–$142 with tight stops.
Below $135.5–134 = breakdown back into the lower GEX zone → bearish PUT play to $131–128.
Options Suggestion:
• Bullish Scenario: 140C or 142C (0DTE/2DTE) if $139 flips support
• Bearish Scenario: 134P or 132P if price fails to reclaim $139 and breaks $135.5
Keep risk small — IV is relatively low so premiums still reasonable.
📉 1-Hour Price Action and SMC Outlook
* Structure: PLTR in a rising channel with clean higher lows
* CHoCH → BOS confirmed: Valid short-term bullish structure
* Current Zone: Consolidating under resistance ($139), forming ascending pennant inside channel
* Support Levels:
* $135.62 → prior CHoCH and EMA confluence
* $134.36 and $132.20 as deeper pullback supports
* Volume: Rising on pushes, fading on retrace → healthy structure
🎯 Trade Setup Ideas:
Bullish:
* Entry: $139 breakout with volume
* Target: $142 → $144
* Stop: Below $135.5
Bearish:
* Entry: Rejection at $139 and break back below $135.5
* Target: $132.2 → $130
* Stop: Above $139.50
📈 Watch for confirmation of breakout or rejection from this wedge. Patience is key.
🧠 My Take:
PLTR is at a decision point — either breakout and trend to mid-$140s, or fakeout and retrace to reload lower. GEX stack shows resistance is thick but not extreme. Smart Money Concepts (CHoCH + BOS + channel structure) suggest bullish bias is intact — but we need confirmation over $139.
Disclaimer:
This analysis is for educational purposes only and does not constitute financial advice. Always manage your risk and do your own research before trading.

PLTR Approaching Key Gamma Resistance–Will 140 Break or Reject?🔍 Options Sentiment (GEX Analysis):
PLTR is pushing into a high gamma zone with notable resistance from options positioning:
* Call Walls are stacked at 140, 142, and 145, with the 145 line aligning with a GEX10 and 2nd Call Wall (86.54%). This suggests significant overhead resistance and a possible hedging zone.
* Gamma flip zone is near 137, where the Highest Positive NETGEX sits — this acts as a pivot or support.
* Below 133, a Put Wall at 130, along with -14.16% NetGEX, offers clear downside targets if bulls lose momentum.
Implied Volatility Data:
* IVR 38.5 / IVx avg 62.3 – Implied volatility is relatively compressed.
* Call positioning is dominant at 38.1%, with GEX showing a ⚠️ yellow signal and diamond risk signals forming — indicating risk of volatility expansion.
🧠 Options Trade Ideas:
Bullish Case (Momentum breakout):
* If PLTR clears 140 with volume, a breakout toward 144–146 is possible.
* Suggested trade:
* Buy 145C or 150C (next week) on breakout + momentum confirmation.
* Ideal for gamma squeeze into overhead walls.
* Cut below 137.
Bearish Case (Rejection & fade):
* Rejection below 140 + shift under 137 would invalidate gamma support.
* Suggested trade:
* Buy 135P or 130P, looking for unwind down to 133 → 130.
* Cut if PLTR reclaims 140 and holds.
⏱ 1-Hour Price Action Analysis (Intraday to Swing Trading):
PLTR has been climbing steadily within a rising wedge channel, forming higher lows and breaking previous CHoCH/BOS zones.
* Recent CHoCH → xBOS confirms bullish intent but we’re currently at a potential short-term supply zone.
* Price is near structural resistance at 139.30–140, while remaining above the ascending trendline support.
📌 Key Levels:
* Resistance: 140 → 142 → 145
* Support: 137 (pivot), 133 (gap/FVG), then 130
* Trendline Support: Ascending, unbroken since early July
💡 Trading Outlook & Strategy:
* This is a "make-or-break" zone — bulls must clear 140 to unlock upside toward 144–146 (in line with call walls).
* Failure to break this level likely triggers profit-taking, especially if macro headwinds align.
* A pullback to 133–137 could provide a clean dip-buy zone, but a breakdown below 133 opens room to 130 and beyond.
✅ Actionable Strategy:
* Break & Hold Above 140 = Long setup
* Target 144/146
* Stop below 137
* Failure at 140 + Break Below 137 = Short setup
* Target 133/130
* Stop above 140
Disclaimer: This analysis is for educational purposes only and does not constitute financial advice. Always do your own research and manage risk carefully.

PLTR Poised for Gamma Squeeze? Here's the Key Setup-July 10📈 GEX Options Sentiment & Trade Strategy
Palantir (PLTR) is pressing into a high-compression zone on the Gamma Exposure (GEX) chart, where multiple call walls cluster between 143 → 146, with the strongest net positive GEX wall at 146, acting as the gamma squeeze ceiling. The 3rd call wall sits at ~145, and momentum is building with IVR 40.6, IVx avg 61.3, and a strong 40.8% bullish call-dollar dominance, signaling sustained call flow.
Crucially, there’s minimal put protection above current price, with most put walls far below at 130, 127, and a weak HVL at 133. This imbalance opens room for a potential gamma push toward 145–146, especially if the 143.17 intraday high breaks with volume.
💡 Options Trade Ideas:
* Bullish Setup:
145C (0DTE or 7/12 expiry) if price confirms over 143.50, targeting the 145–146 zone.
Ideal for a short squeeze continuation with trailing stops.
* Hedge/Defensive PUT:
135P if price rejects sharply at 143.50 and loses 140.5 support—risk-managed fade toward HVL at 134.
🔍 1H Chart Technical Outlook
PLTR is moving inside a rising wedge channel, maintaining a strong bullish market structure with back-to-back CHoCH → BOS confirming bullish intent. Price is consolidating under the supply zone near 143–144, coiled for a breakout attempt. The trendline holds firm, and volume is beginning to expand with each retest.
If price breaks and holds above 143.20, bulls can target 146, and even higher toward the channel resistance near 148.21. However, caution: a false breakout here could trap late bulls, so monitor for retest confirmation before chasing.
Support to watch sits at:
* 139.70 / 139.30 – minor support zone
* 137.40 – EMA + trendline confluence
* 134.52 / 133.00 – critical HVL and invalidation zone
✅ Summary & Trade Plan
* Bias: Bullish with gamma momentum, but nearing exhaustion zone
* Breakout Trigger: Above 143.20 → ride the gamma zone to 145–146
* Key Support: 139.70 / 137.40 (hold = healthy trend)
* Invalidation: Break below 134 = game over for bulls short-term
This analysis is for educational purposes only and does not constitute financial advice. Always do your own research and manage your risk accordingly.

PLTR temporary top?Bearish case
Monthly RSI at 91
Weekly candles encountering resistance
Daily candles under the 20 day SMA
Bullish case
Monthly candle not a clear bearish candle, no monthly volume spike or no monthly RSI double top like SMCI and no bearish divergence detected yet.
Weekly no continuation down after first 2 red weekly candles
Daily volume spike suggest temp bottom
Conclusion
Let's see the next weekly candle from July 7 to 11.

Good scenario for PalantirDo you want coffee NASDAQ:PLTR ?
Palantir has performed excellently throughout 2025 and looks set to continue doing so.

PLTR DUMP INCOMINGdump it dump it dump it.
huge resistance off yearly level. gap on daily chart. Untested levels acting as a magnet lower. Dump it.

Trade Reflection – PLTR Long Setup🧠
Lately, I’ve been focusing on breakouts from key resistance levels supported by ascending trendlines. Today’s trade on NASDAQ:PLTR was a textbook example.
📈 Ticker: PLTR
🔁 Trade Type: Long
🕒 Timeframe: 30-min
📍 Entry Zone: $139.24 (Pre-market breakout)
🎯 Target: $146.66
🛑 Stop Loss: Below $137.00
🔍 Why I Took This Trade:
Price was consolidating right below strong horizontal resistance around $139.
An ascending trendline formed over the past few sessions, creating bullish pressure.
Clean breakout with volume and confirmation on retest.
🧠 What I Learned:
Waiting for confirmation at resistance breakout is key.
Clean structure + trendline + consolidation = high-probability setup.
Reward-to-risk ratio was favorable, with room to $146.
✨ Whether this trade hits TP or not, the setup followed my plan. That’s a win.
📊 Logging and reviewing setups like this helps me stay disciplined and improve daily.

PLTR just started the first phase of the Wyckoff distributionBased on the weekly and daily charts provided for Palantir (PLTR), here is a Wyckoff analysis and a corresponding diagonal option spread strategy.
### **Wyckoff Phase Analysis of PLTR**
From the price and volume action on the charts, **PLTR appears to be in the initial stages of a Wyckoff distribution phase (Phase A)**. This phase marks the stopping of the prior uptrend.
* **Weekly Chart:** The long and powerful uptrend is characteristic of a **Markup** phase. However, the recent price action shows a significant change. The peak near $148.22, followed by a sharp decline, can be interpreted as a **Buying Climax (BC)** and an **Automatic Reaction (AR)**. This is a classic sign that large institutions ("smart money") may be starting to sell or distribute their shares.
* **Daily Chart:** The daily chart shows a failure to make new highs, followed by a very sharp sell-off on a spike in volume. This represents a significant **Sign of Weakness (SOW)** and confirms that the character of the market has changed from bullish to potentially bearish or neutral. The uptrend has been broken.
In summary, the strong upward momentum in PLTR has halted, and the stock is showing clear signs of entering a distribution or consolidation phase at these higher prices.
### **Trading PLTR with a Bearish Diagonal Put Spread**
Given the analysis that PLTR is entering a distribution phase, a neutral to bearish outlook is appropriate. A **bearish diagonal put spread** is a suitable strategy to profit from a potential decline in price or even from the stock trading sideways, as it benefits from time decay.
This strategy involves buying a longer-dated, in-the-money (ITM) put option and selling a shorter-dated, out-of-the-money (OTM) put option.
**How to Structure the PLTR Trade (Current Price ~ $130.74):**
1. **Buy a Long-Term Put:**
* **Action:** Buy to open a put option.
* **Expiration:** Choose a later expiration, for example, **4-6 months out**, to give the distribution and potential markdown phase time to develop.
* **Strike Price:** Select an in-the-money (ITM) strike to create a bearish position. A strike price around **$140 or $145** would be appropriate.
2. **Sell a Short-Term Put:**
* **Action:** Sell to open a put option.
* **Expiration:** Select a near-term expiration, typically **30-45 days away**.
* **Strike Price:** Choose an out-of-the-money (OTM) strike below the current price. For instance, selling the **$120 strike** would provide income and define your risk.
**Example Trade (Illustrative Purposes Only):**
* **Buy 1 PLTR put with an expiration 5 months away at a $140 strike.**
* **Sell 1 PLTR put with an expiration in 35 days at a $120 strike.**
The objective is for the short put to lose value from time decay and expire worthless, allowing you to keep the premium. This premium reduces the cost of your long-term bearish put. You can then sell another short-term put for the following month to continue generating income against your long-term bearish position.
> ***Disclaimer:*** *This content is for informational purposes only and should not be construed as financial advice. Options trading involves substantial risk and is not appropriate for all investors. Please conduct your own research and consult with a qualified financial professional before making any investment decisions.*

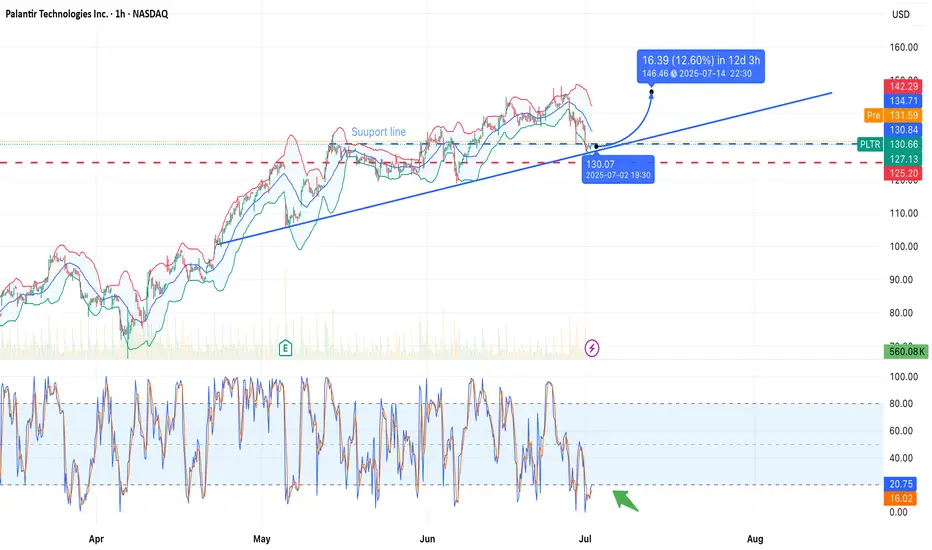
Palantir Technologies (PLTR) — Bounce in Progress?NASDAQ:PLTR is testing a long-term ascending trendline near the $128.79 level, which also aligns with a horizontal support zone. A potential rebound is forming with a projected move toward $145.94 — a +13.32% gain in 12 days.
Technical Highlights:
• Support zone: $128.79 (trendline touch + horizontal level).
• Stochastic Oscillator: Deep in oversold territory — bullish crossover forming (green arrow).
• Bollinger Bands: Price pierced lower band — reversion to the mean is likely.
• Volume: Stable, with room for momentum pickup.
Targets:
• First resistance: $134.71
• Primary target: $145.94
• Stop level: below $127 (to invalidate bullish thesis)
$PLTR - support bounce at $130PLTR - Stock testing bottom of the channel on the daily time frame. Stock has held that support level trice. on high watch if we see a bounce here. Calls above $135 looking good . Stock is decent at the indicator level.

PLTR Looks Ready for a ReboundPLTR Looks Ready for a Rebound — Gamma & SMC Say Watch This Level 👀
GEX Insight: Why Calls Might Be the Move
Looking at the options sentiment chart, we’re sitting on top of the strongest PUT support wall at 130, which lines up with the highest negative NET GEX. This area often marks a pivot or bounce zone. IVR is elevated at 24.8, and while IVX is still higher, GEX is flipping cautiously bullish with GEX 🔴🟢🟢.
💡 If buyers defend this 130 GEX pivot, the flow could shift bullish fast. Smart traders might consider grabbing short-term CALLS around 130 targeting the gap fill toward 137 or even 140 if momentum builds. But if 130 breaks and stays below, PUTS open up down to 127–125 range.
Price Action & SMC Setup
On the 1H chart, structure confirms a bearish BOS after a CHoCH, but price is now stalling at the lower channel and OB box. That green reaction block is the first test of demand in days — if price reclaims above 132.50, expect liquidity to drive back toward 135–137.
Trendline resistance is steep, but any break and hold over 137 could confirm a new bullish CHoCH. That gives us two key zones to watch.
Intraday Trade Plan (Tuesday July 2)
Bullish Scenario
* Entry: Near 130.50–131.00 (call buyers step in on support reclaim)
* Trigger: Break and hold over 132.50
* Target 1: 135
* Target 2: 137–138
* Stop: Below 129.50 (invalidates support)
Bearish Scenario
* Entry: Rejection at 132.00–132.50 or break below 130
* Target 1: 127
* Target 2: 125 (gamma wall zone)
* Stop: Above 133.00 (invalidates the bearish push)
My Thoughts
This is a bounce-or-break zone. If bulls can hold this GEX floor at 130 and reclaim structure on the 1H, we might see a quick short-covering rally. But failure here and PLTR will likely slide down to the next GEX support.
Disclaimer: This is not financial advice. Just a trader’s opinion based on GEX and price action. Always manage risk and trade smart.

PLTR: Encoded Wave Replication IAs bullish wave gets mature on the way up, it draws distinctive tops in a way that warns of bullish exhaustion ahead because to some extent topologically highs indicate a registered rejection of moving further in a local scope (some period).
Scalable Recursive Patterns
If we pay attention to building blocks on smaller scale
Those patterns replicate in bigger scale for example
If the pattern really carries the identified encoding, I'd pay attention to how price retraces within fibonacci channel which is adjusted to the direction of fractal cycle in a clean version.

PLTR: Decoding the Current PullbackPLTR: Decoding the Current Pullback
Current Price Action & Trend:
The asset has experienced a significant uptrend from its late March low of approximately 65.88 (marked as 1 on the Fibonacci tool) up to a peak of 148.44 (marked as 0) in early July. Currently, the price is undergoing a pullback from this recent high, trading around 129. An ascending trendline or channel acts as dynamic support on several occasions during the uptrend.
Key Support Levels & Zones:
"Ideal Area 120" & Ascending Trendline Confluence:
For PLTR an "Ideal Area is 120." This zone is notable as it aligns directly with the ascending blue trendline. This area is served as a point of interest or consolidation during the uptrend, suggesting it could act as a significant support level upon a pullback.
Fibonacci Retracement Levels:
A Fibonacci Retracement tool has been applied from the swing low (65.88) to the swing high (148.44) of the preceding impulse wave.
The 0.5 Fibonacci retracement level is identified at 107.16. This level often acts as a significant support or resistance point.
The 0.618 Fibonacci retracement level, commonly referred to as the "Golden Ratio," is located at 97.42. This level coincides with a broader orange horizontal zone labeled "Fib Golden zone & Strong Level 100." This confluence suggests a particularly strong area of potential support around the psychological 100-mark, bolstered by the Fibonacci ratio. The yellow ellipses indicate prior interactions with this broader zone.
Potential Scenarios (Illustrated by Dotted Lines):
Scenario 1 (Shorter Retracement): This path suggests a potential bounce from the "Ideal Area 120" and the ascending blue trendline, leading to a resumption of the upward movement towards previous highs (148.44) and potentially beyond.
Scenario 2 (Deeper Retracement): This path illustrates a possible deeper pullback, indicating that if the "Ideal Area 120" does not hold, the price might seek support at the "Fib Golden zone & Strong Level 100" (0.618 Fib level around 97.42) before a potential reversal and continuation of the broader uptrend.
Conclusion:
The current price action is undergoing a correction within a defined uptrend. Technical levels, including dynamic trendline support and static Fibonacci retracement zones, are presented as key areas for observation, offering insights into potential points of interest for future price reactions.
Disclaimer:
The information provided in this chart is for educational and informational purposes only and should not be considered as investment advice. Trading and investing involve substantial risk and are not suitable for every investor. You should carefully consider your financial situation and consult with a financial advisor before making any investment decisions. The creator of this chart does not guarantee any specific outcome or profit and is not responsible for any losses incurred as a result of using this information. Past performance is not indicative of future results. Use this information at your own risk. This chart has been created for my own improvement in Trading and Investment Analysis. Please do your own analysis before any investments.

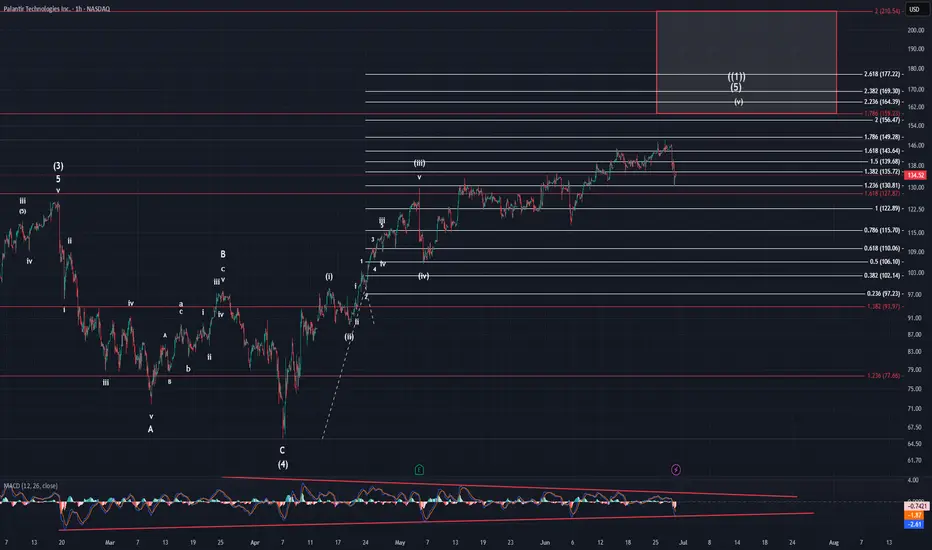
PalantirOn Friday Palantir dropped pretty hard causing MACD to drop all the way to our bottom trend line. It created overlap with the pattern which brings a further rise to the target box into question. On thing I can say about this pattern with certainty, is it is very sloppy. It in no way appears as an impulsive pattern due to the choppy overlapping nature of it. This is what leads me to believe it is an ED.
If it is an ED that leaves us with two possibilities. It is either within its wave 4, which would explain the overlap, or it just finished (v) of (5) of ((1)). We need more price action to determine which count prevails. A drop below $117.22 and that is a huge warning that the upside is done. Below $105.32 and that confirms it for me.
To raise higher again breaching our ATH shows that the ED is not yet done and we're most likely rising to the $160 area. Don't forget, when an ED finished, it moves towards the place of origin in a strong move.
"Steal the Market: PLTR Trading Strategy Revealed!"🌟 Hola, Money Snatchers & Market Rogues! 🌟
Ready to hit the vault? 💰💸✈️
Here’s the ultimate plan for lifting loot from PLTR (Palantir Technologies Inc.) using the infamous Thief Trading Style. This is no rookie job—we’ve got the techs and the fundamentals to nail the target. Our sights are locked on the high-stakes Red Zone: nuclear resistance, overbought territory, trend reversals, and that sweet electric trap where traders and bearish bounty hunters lie in wait. 🏆💸 It’s time to bag those profits and live like a kingpin!
Entry Point 📈:
Doors are wide open! Snatch that bullish loot at any level—it’s a free-for-all! For extra stealth, set your buy limits around recent 15–30 min swing highs or lows. Pro tip: throw in some chart alerts to stay ahead of the game.
Stop Loss 🛑:
Our Thief SL lands at the recent 2h swing low (116.00) on a swing-trade basis—tight enough to dodge the cops but wide enough to let the heist breathe. Adjust based on your bankroll and risk appetite—don’t get greedy, and always plan your getaway.
🏴☠️ Target 🎯: 152.00—or duck out early if the sirens start blaring!
🧲 Scalpers, listen up 👀:
Only scalp on the long side—no backstabbing shorts here! If you’ve got the bankroll, go all-in; otherwise, team up with swing traders and ride the big wave. Use a trailing SL to keep your loot safe from sudden ambushes.
PLTR (Palantir Technologies Inc.) is on a bullish tear—thanks to a mix of market signals and that sweet fundamental juice:
📰🗞️ Stay locked in with the latest—fundamentals, macro reports, COT updates, geopolitical heat, sentiment, intermarket moves, index breakdowns, position shifts, and trend forecasts. Link’s in the bio—don’t miss it! 👉👉👉
📌 Pro Tip: Markets can flip faster than a getaway car—stay sharp and ready to pivot.
⚠️ Trading Alert:
News drops can spike the alarm system—here’s how to keep your loot safe:
🚫 Skip new trades during releases
🚏 Lock in profits with trailing stops—no one likes getting caught!
💖 Show some love for the crew—💥 Smash that Boost Button 💥—and keep the Thief Trading Style alive. Let’s make bank every day like true market outlaws! 🏆💪🤝❤️🎉🚀
Stay tuned—another big score’s just around the corner! 🤑🐱👤🤗🤩

PALANTIR vs S&P500 INDEX. WILL AI UPBEAT TYCOON BUFFETT ITSELFFar far ago, somewhere in another Galaxy, in late December, 2024 (yet before The Second Coming of Trump), @TradingView asked at it awesome Giveaway: Happy Holidays & Merry Christmas.
1️⃣ What was your best trade this year?
2️⃣ What is your trading goal for 2025?
Here's what we answered:
1️⃣ What was your best trade this year?
- Surely Palantir NASDAQ:PLTR 💖
I followed Palantir all the year since January, 2024, from $16 per share, watch here .
Current result is 5X, to $80 per share.
Also I added more Palantir after SP500 Index inclusion in September 2024 watch here .
Current result is 2.6X, from $30 to $80 per share.
2️⃣ What is your trading goal for 2025?
- Once again, surely Palantir NASDAQ:PLTR 💖
It's gone 6 months or so... (Duh..? Ahaha.. 6 months already, really? 😸😸😸)
Let see what's happened next at the main graph PLTR/SPX
First of all, let me explain in a few words what does this graph mean.
Rising (Blue) candle means Palantir PLTR monthly return is better vs SPX
Falling (Red) candle means Palantir PLTR monthly return is worse vs SPX
Conclusion
Palantir. The stock that outperformed S&P 500 Index, 12 consecutive months in a row.
Palantir. The stock that printed 12x since inception. 5.5x over the past twelve month and 1.8x in the year 2025 (one the best results so far over the all S&P 500 Index components).
Palantir. The stock that goes to UPBEAT Tycoon Buffett record, that has been achieved in early 1990s (in 1992-93 Berkshire Hathway outperformed S&P 500 Index for straight TWELVE MONTHS).
Palantir. The stock that goes to repeat Microsoft NASDAQ:MSFT record, that has been achieved in 1990s (in 1996-97 Microsoft outperformed S&P 500 Index for straight THIRTEEN MONTHS).
Palantir. Were we right with this stock on contest and won it? Exactly! Even though our prize has been toadly strangled. 🤭
//P.S. We did not find any biggest series then 13-month straight gain. Microsoft 13 straght months superiority over S&P500 index is the biggest ever series in history we found.
//P.P.S. Just one day left (June 30, 2025) to a very potential and a very historical event.
--
Best wishes,
Your Beloved @PandorraResearch Team 😎

PUT a little PLTR - $100 ? ok, let's buy there too?As of Friday, June 27, 2025, at 9:19:58 PM PDT, here's an analysis of PLTR:
Current Price & Performance:
Last Price: $130.74 (as of 4:00 PM ET on June 27, 2025)
Today's Change: Down $15.57 (-10.64%)
After-hours price: $134.52 (up 2.89% as of 7:59 PM ET on June 27, 2025)
Previous Close: $146.31
Today's Range: $130.54 - $144.97
52-Week Range: $21.23 - $148.22
Williams Alligator Analysis (Daily Chart):
The Williams Alligator indicator uses three smoothed moving averages, often referred to as the Jaw (blue line), Teeth (red line), and Lips (green line), with specific periods and shifts. The common default settings are:
Lips (Green Line): 5-period Smoothed Moving Average (SMMA), shifted 3 bars into the future.
Teeth (Red Line): 8-period SMMA, shifted 5 bars into the future.
Jaw (Blue Line): 13-period SMMA, shifted 8 bars into the future.
Interpreting the Alligator:
"Sleeping" Alligator: When the three lines are intertwined or very close together, it indicates a non-trending or consolidating market. This is often a period to avoid trading or to take profits.
"Awakening" Alligator: When the lines start to diverge, with the Lips (green) crossing the Teeth (red) and Jaw (blue), it signals a potential new trend forming.
Green crossing above Red and Blue: Suggests a bullish awakening.
Green crossing below Red and Blue: Suggests a bearish awakening.
"Eating" Alligator (Mouth Wide Open): When the lines are fanning out and moving in a clear direction (e.g., Green > Red > Blue for an uptrend, or Blue > Red > Green for a downtrend), it indicates a strong trending market.
Current PLTR Alligator State (Based on recent price action):
Palantir experienced a significant pullback today (-10.64%), which followed a period of strong upward movement and nearing its 52-week high.
Recent Trend: Prior to today's drop, PLTR was in a strong uptrend, likely characterized by the Alligator's mouth being "open" upwards (Green above Red, Red above Blue).
Today's Action: A sharp drop like today's could cause the Lips (green line) to cross below the Teeth (red line), and potentially even the Jaw (blue line), or at least begin to converge. This would indicate:
Potential "Sating" or "Sleeping": The sharp drop suggests the Alligator might be moving from an "eating" phase (uptrend) towards a "sated" or "sleeping" phase, where the trend is losing momentum or consolidating.
Bearish Crossover (Possible): If the green line has crossed below the red and blue lines, it would be a bearish signal, indicating a potential reversal or the start of a downtrend. It's crucial to see the actual chart to confirm the precise line positioning. However, a 10%+ drop from a recent high strongly implies such a shift.
MACD (Moving Average Convergence Divergence) (8,13):
The MACD uses two Exponential Moving Averages (EMAs) to identify momentum and potential trend changes. The standard MACD settings are typically 12-period EMA, 26-period EMA, and a 9-period Signal Line. You've requested (8,13) which means:
MACD Line: (8-period EMA of Close - 13-period EMA of Close)
Signal Line: 9-period EMA of the MACD Line
MACD Histogram: MACD Line - Signal Line
Interpreting MACD:
MACD Line crossing above Signal Line: Bullish crossover, suggests upward momentum.
MACD Line crossing below Signal Line: Bearish crossover, suggests downward momentum.
MACD Histogram: Positive and increasing indicates strengthening bullish momentum. Negative and decreasing indicates strengthening bearish momentum.
Current PLTR MACD (8,13) State:
While specific MACD (8,13) values aren't readily available without a real-time chart for today's close, we can infer based on the significant price drop:
Prior to Today: Given PLTR's recent upward trend, the MACD (8,13) was likely positive, with the MACD line above its signal line, and a positive histogram.
Today's Action: A sharp 10%+ decline would almost certainly cause a bearish crossover on the MACD (8,13). This means the MACD line would have likely crossed below its signal line, and the MACD histogram would have turned negative and started to decrease, indicating strong bearish momentum and a potential shift in the short-term trend.
Combined Analysis for PLTR:
Today's significant drop in Palantir's stock price strongly suggests a shift from a bullish trend to a more bearish or consolidating phase.
Williams Alligator: The "mouth" of the Alligator, which was likely open upwards, has probably begun to close or even reverse, with the green Lips line potentially crossing below the red Teeth line, signaling a weakening or reversal of the uptrend. The Alligator is likely moving towards a "sated" or "sleeping" state.
MACD (8,13): A bearish MACD crossover is highly probable, with the MACD line falling below its signal line and the histogram turning negative, confirming the strong downward momentum.
Conclusion:
Based on the daily chart analysis using Williams Alligator and MACD (8,13) indicators, Palantir's current price action indicates a significant loss of bullish momentum and a potential short-term reversal or consolidation. Both indicators likely point to a bearish shift following today's sharp decline.
Important Disclaimer: This analysis is based on available data and general interpretations of these indicators. Technical analysis is not foolproof and should be used in conjunction with fundamental analysis and other forms of research. Market conditions can change rapidly. Always consult with a qualified financial advisor before making any investment decisions.

PLTR: Sell ideaSell idea on PLTR as you can see on the chart if and only if we have the breakout with force
the Belkhayate Iceberg, the vwap and the support line by the sellers.

Palantir Technologies ($PLTR) – Institutional Playbook Reactivat📍 Technical Snapshot
NASDAQ:PLTR just completed a textbook liquidity sweep and bounced off a deep demand zone. The CHoCH and BOS flips on the 15-minute confirm a shift in structure, hinting at the re-entry of smart money into the market. Current price is reclaiming the equilibrium zone, with upside targets visible well into premium territory.
📊 VolanX DSS Trade Scenarios
✅ Scenario A – Bullish Continuation (75% Probability)
Structure flip confirmed above $138.67
Volume buildup with clean absorption in the blue zone
If sustained, expect a run through:
T1: $146.00–$148.00 (Strong High & Premium Zone)
T2: $155.66 (1.618 extension level)
⚠️ Scenario B – Failure to Hold (25% Probability)
Break below $136.43 invalidates the bullish bias
Next support lies at $132.00–$130.00 (final weak low zone)
📈 Execution Strategy
Entry: Post-retest of $138.55 CHoCH zone with bullish candle
Stop Loss: $136.00 (below BOS and low-volume shelf)
Targets: $146 → $155.66
RRR: 3.5x–4.5x depending on precision entry
🧠 Confirmation Points:
Clear CHoCH recovery + BOS above liquidity sweep
Price reclaimed equilibrium zone
Weak hands flushed, premium inefficiency remains unfilled
💡 “Smart Money doesn’t chase price — it engineers imbalance.” – VolanX Protocol
🔐 Published by WaverVanir International LLC – powered by DSS Tactical Systems
#PLTR #Palantir #SmartMoneyConcepts #VolanX #LiquiditySweep #MarketStructure #RiskManagement #BreakoutStrategy #InstitutionalOrderFlow #WaverVanir

Palantir Technologies Poised for AI-Driven RallyCurrent Price: $130.74
Direction: LONG
Targets:
- T1 = $134.50
- T2 = $140.00
Stop Levels:
- S1 = $129.00
- S2 = $126.50
**Wisdom of Professional Traders:**
This analysis synthesizes insights from thousands of professional traders and market experts, leveraging collective intelligence to identify high-probability trade setups. The wisdom of crowds principle suggests that aggregated market perspectives from experienced professionals often outperform individual forecasts, reducing cognitive biases and highlighting consensus opportunities in Palantir Technologies.
**Key Insights:**
Palantir Technologies (PLTR) has emerged as a critical player in the enterprise AI space, with expanding applications across government sectors and industrial collaborations. Recent developments demonstrate a strategic pivot towards nuclear energy and infrastructure projects, emphasizing Palantir’s commitment to broadening its addressable market. These expansions imply long-term growth potential as the company continues to stake claims in critical industries. Despite short-term headwinds from index rebalancing, Palantir exhibits strong fundamentals and growth trajectory backed by enterprise adoption and innovation.
**Recent Performance:**
Palantir has displayed resilience amid market volatility, correcting from a high of $146.00 to its current price of $130.74. This pullback followed a strong rally earlier in the quarter, reflecting both investor optimism and technical consolidation. The stock has respected key support levels above the 180-day simple moving average, indicating a strong bullish bias even in turbulent times.
**Expert Analysis:**
Analysts agree that Palantir’s robust partnerships in industrial sectors, including nuclear energy innovation, signal strategic diversification away from government contracts. AI adoption trends and operational efficiencies further validate its premium valuation. With a bullish MACD crossover and an RSI still in non-overbought territory, technical indicators indicate room for upside.
**News Impact:**
The Russell index rebalancing created short-term selling pressure, possibly triggering oversold conditions. However, Palantir’s continued expansion into critical energy sectors and its strategic partnership announcements are driving positive sentiment among institutional investors. These developments suggest significant growth potential and improved shareholder value in the mid-to-long term.
**Trading Recommendation:**
Palantir Technologies offers a compelling bullish opportunity as price action suggests continued upside potential driven by enterprise AI growth and industrial diversification. Investors targeting long positions should consider levels above $130.74 with stop-loss strategies at $126.50, aiming for target zones above $140.00 where the company’s valuation aligns with growth projections.

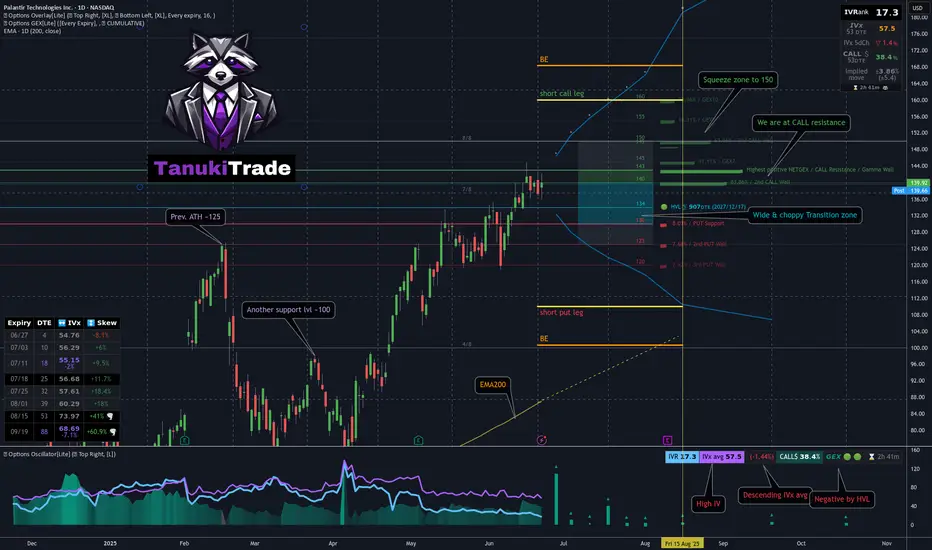
Jade Lizard on PLTR - My 53DTE Summer Theta PlayMany of you — and yes, I see you in my DMs 😄 — are trading PLTR, whether using LEAPS, wheeling, or covered calls.
I took a closer look. And guess what?
📈 After a strong move higher, PLTR was rejected right at the $143 call wall — pretty much all cumulative expiries cluster resistance there
Using the GEX Profile indicator, scanning all expirations:
After a brief dip, the market is repositioning bullish
Squeeze zone extends up to 150
The most distant GEX level is sitting at 160
On the downside, 130 is firm support, with some presence even at 120 — the market isn’t pricing in much risk below that
📉 From a technical standpoint:
We’re near all-time highs
125 (previous ATH) and 100 are key support levels
The OTM delta curve through August is wide, and the call side is paying well — with a current call pricing skew
🔬 IVx is at 57, trending lower + call pricing skew📉 IV Rank isn't particularly high, but the directional IVx matters more here
💡 Summer Theta Play: Jade Lizard on PLTR
Since I’ll be traveling this summer and don’t want to micromanage trades, I looked for something low-touch and high-confidence — and revisited an old favorite: the Jade Lizard.
If you're not familiar with the strategy, I recommend checking out Tastytrade's links and videos on Jade Lizards.
🔹 Why this setup?
Breakeven sits near $100, even with no management
On TastyTrade margin:~$1800 initial margin ~$830 max profit
53 DTE — plenty of time for theta to work
Earnings hit in August — I plan to close before then
Covers all bullish GEX resistance zones
Quickly turns profitable if IV doesn’t spike
Highly adjustable if needed
My conclusion: this strategy covers a much broader range than what the current GEX Profile shows across all expirations — so by my standards, I consider this to be a relatively lower-risk setup compared to most other symbols right now with similar theta strategies.
🔧 How would I adjust if needed?
If price moves up:
I’d roll the short put up to collect additional credit
Hold the call vertical as long as the curve supports it
If price drops:
Transition into a put ratio spread
Either extend or remove the call vertical depending on conditions
🛑 What’s the cut loss plan?
I have about 20% wiggle room on the upside, so I’m not too worried — but if price rips through 160 quickly, I’ll have to consider early closure.
If that happens, the decision depends on time:
If late in the cycle with low DTE:→ Take a small loss & roll out to next month for credit
If early with lots of DTE remaining:→ Consider converting to a butterfly, pushing out the call vertical for a small debit→ Offset this with credit from rolling the put upward
As always — stay sharp, manage your risk, and may the profit be with you.
See you next week!– Greg @ TanukiTrade
Bearish Divergences - Short TriggeredThis move up in the fifth wave is showing a bearish divergence on the RSI. I expected us to reach the $146-150 level. I have entered a short position with a tight stop loss. Nobody knows when the party's over, I'll take my chance here and if I am proven wrong, it will only be at a small loss.
Not financial advice.
