PLTR 1D — When the tea is brewed and the handle’s in placePalantir’s daily chart is shaping up a textbook cup with handle pattern — one of the most reliable continuation setups in technical analysis. The cup base was formed over several months and transitioned into a consolidation phase, building a rectangle structure where smart money likely accumulated positions before a breakout.
Now here’s the key: price has not only broken out — it’s settled above all major moving averages, including EMA 20/50/100/200 and MA 50/200. The breakout candle was supported by surging volume, signaling strong participation from institutional buyers. When all the averages start bending upwards, it's usually not by accident.
The breakout above the $121 resistance zone unlocked a pathway toward a target at $187 , derived by projecting the height of the cup upward from the breakout level. This kind of structure, once confirmed, often fuels aggressive continuation — and this one’s got the setup locked in.
From a fundamental perspective, Palantir is holding solid ground: strong earnings reports, expanding government and commercial contracts, and aggressive development in AI services. Institutional interest is rising steadily, and that momentum is visibly reflected in price action.
To sum it up: price has launched cleanly out of the consolidation zone, pierced all critical MAs and EMAs, and continues to gain momentum. While the market sips its tea, this cup is boiling hot. Just don’t forget your stop loss — this is a trading desk, not a tea party.
If you enjoy posts like this, drop a like, share it around, and let’s hear your thoughts below. It keeps ideas moving and the content flowing — free, sharp, and relevant.
PLTR trade ideas

PLTR Breaking Resistance: Gamma Squeeze Potential to $144–$148?🧠 GEX Insights – Options Setup
* Current Price: $143.23
* Highest Positive GEX Level: $142.00
* Next Call Walls:
* $144.00 → +31.09% GEX (3rd Call Wall)
* $148.00 → +46.45% GEX (2nd Call Wall)
* IVR: 13.7 (low)
* IVX Avg: 55.2 → IV is underpriced, suitable for long calls
* Call Flow: 37.3% bullish
* GEX Sentiment: 🟢🟢🟢 (Bullish)
💡 Interpretation: Price is sitting above the highest positive GEX zone and just broke into the first major gamma wall at $143. If price sustains this breakout, market makers may be forced to hedge by buying more shares, leading to a gamma squeeze toward $144 → $148.
📊 Trade Idea – Technical Chart Thesis
From the second chart:
* Strong Break of Structure (BOS) just occurred above the $142.15 resistance
* Price reclaimed the pink supply zone and is attempting continuation
* Trendline support is intact from recent higher lows
* Volume is increasing on breakout, confirming momentum
📈 Bullish Scenario:
* Entry: Above $143.20 (confirm breakout retest or continuation)
* Targets:
* TP1: $144.00
* TP2: $147.13
* Stretch TP: $148.00
* Stop-loss: Below $141.80 or trendline
* Options Play: Buy 6/28 or 7/5 $145C or $147C if volume continues rising
📉 Bearish Rejection Setup (if false breakout):
* If price fails to hold $143.00 and breaks $142.00 with volume → reverts to $139 zone
* Consider short-term PUT only if price reclaims below $141.80 with confluence
✅ Summary
* ✅ GEX favors CALLs, and breakout aligns with technical strength
* ✅ Volume + BOS + GEX = strong confluence
* ⚠️ Watch for consolidation near $144 and fade if unable to break
* 🎯 Most likely scenario: move to $144–$147 range by midweek
This analysis is for educational purposes only and not financial advice. Trade with proper risk management.

6/24/25 - $pltr - Porti update6/24/25 :: VROCKSTAR :: NASDAQ:PLTR
Porti update
- decided to do it on this "heads i win tails you lose" stonk
- good luck to the believers.
portfolio - i think mkt is cooked but could melt up. so i dug in my heels. 3 names i like. and shorts that r cheap and silly expensive. let's see who wins.
i'm gross ~180%, net ZERO
longs
OBTC at 45%
NXT '27 leaps 15-20%
GAMB at 30%
(sold HIMS for now, forgive me ;)
shorts
IBIT (hedge to OBTC convert)
BUG
QUBT
ROBT
UFO
ASTS
PLTR
CVNA
let's see. careful out there. tape looks low IQ.
V

Will PLTR Push Through the Gamma Wall? Jun 24🔍 Overview:
Palantir Technologies (PLTR) is trading at $139.92 (+1.91%) as of June 23 close. After days of range-bound action, bulls are trying to reclaim critical levels while battling overhead gamma resistance. With Smart Money Concepts showing both BOS and CHoCH, the next move could be explosive.
🔩 Market Structure (SMC View):
* 15m Chart:
* Clear Break of Structure (BOS) upward in morning session.
* Followed by Change of Character (CHoCH) bearish in the afternoon.
* Price tapped into a green demand zone and reacted with a bounce near $137.
* A re-test of the red CHoCH supply zone around $140.50–$141.30 is in progress.
* Trendlines suggest a tightening wedge, with the top of the channel converging near $144.
🧠 GEX and Options Sentiment:
* Gamma Wall (Call Resistance):
🔼 $142–143 zone – Highest net GEX (CALL wall), where market makers may start shorting gamma, creating resistance.
* Major Call Walls:
* $145 (12.37% GEX)
* $149–150 (Strongest 2nd layer walls)
* PUT Wall Support:
* $130 major PUT support (7.49% wall)
* $134 is minor soft support area.
* IV & Sentiment:
* 📉 IV Rank (IVR): 17.3 – low, indicating cheap premiums.
* Call Buying Strength: 38.4% – moderately bullish.
🔄 Key Zones:
* 🔴 Supply Zone (CHoCH): $140.50–$141.30
* 🟢 Demand Zone (CHoCH): $135.97–$137.30
* ⚠️ Trap Range: Between $137 and $141 — liquidity likely to be swept in both directions before a move.
📈 Trade Setups:
Bullish Scenario:
* Entry: On break and close above $141.50 with retest confirmation.
* Targets:
* $143 → Minor profit-taking zone
* $145 → Next GEX wall
* $149–$150 → High GEX squeeze potential
* Stop: Below $137.30 or mid-channel around $136.50
📌 Ideal if price reclaims above the CHoCH zone and builds volume support near $141.
Bearish Scenario:
* Entry: Rejection from $141.30 supply or breakdown under $137.
* Targets:
* $135.97 → First reaction zone
* $134 → Secondary support
* $130 → Strong GEX-supported PUT level
* Stop: Above $141.60 or structure high of $142.15
📌 Watch for reversal signs inside supply zone or heavy selling into demand.
🔮 Bias:
Neutral-to-Bullish → ⚔️ Battle at $141 CHoCH zone. Gamma resistance is real, but if broken, it could fuel a gamma squeeze toward $145+.
💡 Actionable Advice:
* Scalpers: Fade resistance near $141.30 unless it breaks clean.
* Swing Traders: Wait for break and retest of $141.50 → target $145+.
* Options Traders:
* Low IVR = Great time to buy CALLS if bullish.
* If expecting chop, long straddle at $140 may work before the move.
📌 Conclusion:
PLTR is consolidating right beneath a major gamma wall and previous SMC CHoCH level. If bulls can break through $141.50 with strength, we could see a momentum move to $145 and even $150 this week. Until then, volatility traps remain likely within $137–$141.
Disclaimer: This analysis is for educational purposes only and does not constitute financial advice. Always do your own research and trade responsibly.

Long-Term Growth Opportunity Awaits Breakout
Targets:
- T1 = $140.00
- T2 = $145.00
Stop Levels:
- S1 = $133.00
- S2 = $130.00
**Wisdom of Professional Traders:**
This analysis synthesizes insights from thousands of professional traders and market experts, leveraging collective intelligence to identify high-probability trade setups. The wisdom of crowds principle suggests that aggregated market perspectives from experienced professionals often outperform individual forecasts, reducing cognitive biases and highlighting consensus opportunities in Palantir Technologies.
**Key Insights:**
Palantir Technologies has established itself as a leader in AI and big data analytics, consistently attracting investor interest due to its strong positioning in key markets. The stock demonstrates resilience near $135, which serves as psychological support, while contracts with government and enterprise sectors add further stability to its growth story. Palantir's innovative solutions and its ongoing expansion into commercial sectors are critical drivers of the bullish outlook.
**Recent Performance:**
Palantir's recent price movements have showcased its ability to maintain relative strength despite broader market volatility. The stock has remained favorably positioned near its upper-tier price range, reinforcing bullish sentiment. Institutional investors have shown confidence near the $135 level, which serves as a springboard for further upward movement.
**Expert Analysis:**
Market experts emphasize Palantir's focus on AI advancements and its role as a strategic partner in government and enterprise operations. This positions the company as a standout player within the data analytics landscape, with continued demand for its services reflecting market optimism. The firm’s technological expertise and its resilience within competitive sectors underpin its long-term growth potential.
**News Impact:**
Recent developments, including government contracts and advancements in artificial intelligence technology, significantly bolster Palantir's outlook. Strategic initiatives to diversify its services and increase penetration into commercial sectors have improved investor sentiment and strengthened the bullish thesis. As AI-related services gain traction globally, Palantir remains well-poised to capture sustained demand and market expansion.
**Trading Recommendation:**
Investors should consider a LONG position in Palantir Technologies, capitalizing on its innovative offerings and strong growth catalysts. The $135 level presents a solid support zone, with price targets at $140 and $145 reflecting near-term opportunities for gains. Tailored stop-loss levels ensure risk mitigation while maintaining exposure to the stock's upward potential.

PLTR at a Decision Point – Will It Defend or Break Lower? Jun 23PLTR at a Decision Point – Will It Defend This Channel or Break Lower?
🔹 Options Sentiment (GEX) Overview:
* Current Price: $137.30
* Gamma Flip Zone: $140.00 (HVL, short-term battleground)
* Call Walls:
* $143.00 (2nd Call Wall)
* $150.00–$152.5 (3rd Call Wall + GEX resistance zone)
* Put Walls:
* $136.00 → minor defense
* $130.00 → strongest Put Support (-45% GEX floor)
* GEX Bias: 📉 Bearish leaning
* GEX: 🔴
* IVR: 20.3 (very low)
* IVx: 64.8 (dropping -4.49%)
* CALLs: 39.9% → PUTs dominant
🧠 Interpretation: GEX is suggesting downside pressure below $140. If bulls can’t reclaim it soon, momentum could shift fast toward $136 → $130 support.
📈 Price Action (1H Intraday - SMC Insight):
* Current Structure:
* Multiple CHoCH (Change of Character) pointing to weakness
* Price broke below the ascending trendline
* Forming a local bearish block beneath $140
* PDH/Resistance: $144.86
* Support:
* $137.42 (short-term)
* $136.08 (SMC support + GEX alignment)
📉 Market Structure Bias: Bearish short-term unless it reclaims the $140 zone and breaks the descending micro-structure.
🎯 Trade Setup Ideas
🔻 Bearish Scenario (If weakness continues):
* Entry: Below $137.20
* Target: $136.08 → $133 → $130
* Stop: $140.00 reclaim
* Confluence: CHoCH + GEX Put Wall magnet + failed trendline defense
🔼 Bullish Reversal Scenario (Only on reclaim):
* Entry: Break & hold above $140.00
* Target: $143 → $144.86 → $150
* Stop: Breakdown back below $139
* Confluence: GEX Flip + Channel re-entry + Institutional Call Wall targets
🔍 Final Thoughts
PLTR is sitting near a critical decision level around $137–$140. Options sentiment (GEX) shows dominant PUT flow and a bear bias below $140, while price action is showing early signs of structure breakdown. If bulls cannot recover $140 early in the week, we could see a slow grind toward the $130 PUT Support zone. Use caution near the $136–$137 liquidity pocket — it's a key short-term decision area.
This analysis is for educational purposes only and does not constitute financial advice. Always do your own research and manage risk appropriately.

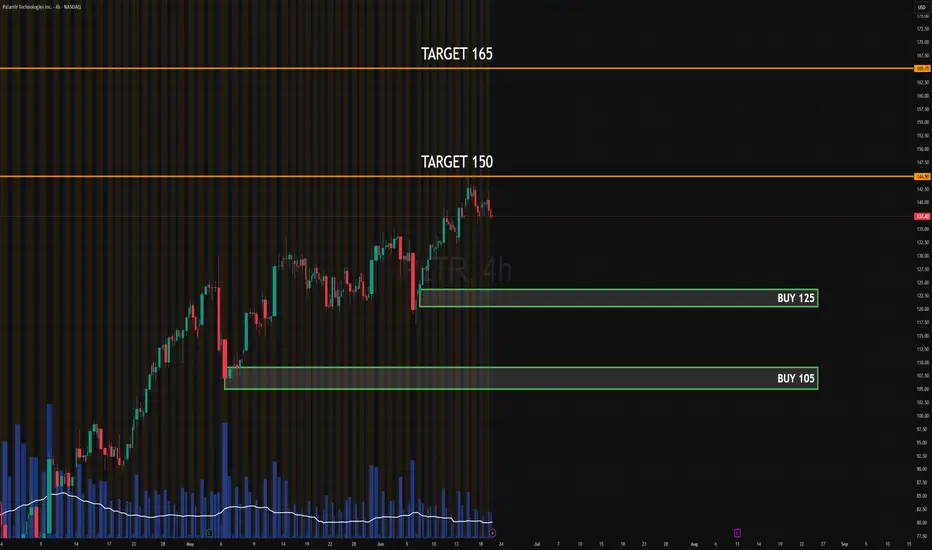
PLTR JUN - JUL 2025 EARNINGSLong from $125 or $105 with confirmation.
📤 Short if $125 breaks and no absorption is seen.
Key resistance: $150 / $165
Key support: $125 / $105
PLTR: Broad Cycle Breakdown via Fibs Interference Pattern
Growth angle
ST downtrend angle
Highlighting shape of expansion + scaling the structure to new axis that advances after establishing longer term full cycle.

PLTR – Preparing for a Pullback? Or Just Loading Up the Ammo?🚀Palantir (PLTR) has been riding the AI wave hard, reaching fresh highs recently on strong earnings and explosive momentum. But even rockets need to refuel and that’s where our strategy comes in. 📉📈
After tagging all-time highs, PLTR could enter a healthy pullback phase. That’s not weakness that’s opportunity for the smart trader. Here are the levels I’m watching to re-engage:
🔹 Entry Zones
✅ $128 – first buying zone, post-euphoria fade
✅ $120 – deeper support & volume base
✅ $108 – high-conviction, long-term add level
📊 Why it matters:
Palantir just boosted guidance, U.S. commercial deals are booming, and the AI business remains strong. But valuations are stretched, and macro headwinds could test investor confidence. Any dip into these zones might offer a golden entry.
🎯 Profit Targets
💰 TP1: $142 – short-term bounce potential
🚀 TP2: $155 – previous bullish target from analyst upgrades
🌕 TP3: $180+ – longer-term breakout if AI narrative holds strong
⚠️ Disclaimer: This is not financial advice. Always do your own research and manage risk according to your strategy.

PLTR NEVER disappoints Market Context
NASDAQ:PLTR | Current Price: $120.28
1-Month Move: +50.83% (from $82.30)
1-Year Move: +449.91% (from $22.60)
Options Data
IV Rank: 77.2 (juicy premiums )
Put/Call Ratio: 0.90 (slightly bullish tilt )
Max Pain: $115.00
High OI: $125 calls , $110 puts
Trade Setup
Strategy: Single-leg, naked call (bullish, defined risk)
Instrument: PLTR
Direction: CALL
Strike: $130.00 (premium $0.85, fits $0.50–$1.00 band)
Expiry: 2025-05-09 (first weekly post-earnings)
Entry Price: $0.85
Entry Timing: Pre-earnings close (2025-05-05)
Profit Target: $1.70 (~100% gain )
Stop Loss: $0.43 (~50% loss )
See you after earnings.
BEST Ai Signals on the market :)

Who’s with me on PLTR?PLTR is showing a very clear and strong bullish trend, making this an A+ trade setup in my book – especially given how close the price is to a key level. 🔍
🔹 Liquidity Sweep Setup:
On Friday, June 13, the opening swept the liquidity created on Wednesday, June 11 at 9:40 AM – an institutional move that left an imbalance candle.
Then, at 8:30 AM on the same Friday, liquidity was taken below the 5:30 AM low, setting the stage for a strong institutional move at the 9:30 AM opening.
Just before the open, at 9:20 AM, a Fair Value Gap (FVG) was formed – this became our focus entry area, which also aligned with resistance points from June 10, 11, and 13. 📊
🔹 A+ Trade Conditions:
What makes this trade so attractive is how the 9:30 AM candle created bearish liquidity, giving us a clear liquidity point to target for our entry. This aligns perfectly with the Vep Trader liquidity sweep strategy. ✅
📍 Trade Setup:
Entry: $133.33
Stop Loss: $132.00
Take Profit: $140.00
Let’s see how this plays out! Who’s riding this wave with me? 🌊💰
#PLTR #Stocks #TradingView #LiquiditySweep #FVG #PriceAction #SmartMoney #DayTrading #OptionsTrading #StockMarket #BullishSetup #VepTrader #TechnicalAnalysis #MarketStructure

PLTR Quick Take: GEX & Chart Analysis-Jun 161️⃣ Gamma Context (1‑Hour Chart)
* A strong call gamma wall is forming around $143–145, with positive NET-GEX resistance near $150—dealers likely hedging up here, creating a short-term cap.
* Put gamma support sits at $131–134, providing a risk floor.
* Implied volatility sits mid-range (~25%), making options moderately priced—with bull call spreads around $140–145 being attractive if momentum aligns.
2️⃣ Price Structure & Momentum (15‑Min Chart)
* Support: Price held just above the $132–134 consolidation zone and bounced twice, showing clean rotation from support → BOS.
* Resistance: After the break above $139–140, sellers stepped in near $142–143 supply area, causing a CHoCH (Change of Character) indicating potential stall or pullback.
* Trendline dynamics: A rising trendline from morning lows offers intraday context. As long as that holds, upward bias remains valid.
3️⃣ Trade Idea & Execution
* Bullish Base: If PLTR climbs and retests $139–140 with momentum, consider initiating a $140–145 bull call spread. This plays for a move into the gamma wall while capping defined risk.
* Stop‑loss level: Watch for a dip below the trendline or $136–137. If that breaks, shift to neutral—no entries—until a fresh structure forms.
* Alternative scenario: A breakdown below $134 could trigger a put spread down toward $131–132, leveraging the put-side gamma wall as a target.
💡 Why This Setup?
* Gamma-based resistance aligns your trade horizon with key option dynamics—maximizing R/R while staying sensible.
* Defined-risk bullet spreads offer clarity and cost efficiency in these mid IV levels.
* Confluence on the chart—support hold and structural rotation—boosts confidence in directional bias.
⚠️ TradingView Disclaimer
This content is for educational purposes only and not investment advice. Options involve significant risks and may not be suitable for all investors. Always determine your strategy, position sizing, and risk management before trading. Ensure clarity on structure breakout or breakdown before opening a position.

PLTR – Structure Holding… For Now (4H Outlook)Palantir is compressing near ATHs, but showing early signs of exhaustion on higher timeframes. On the 4H chart, structure is still bullish — but fragile.
🔍 Key Technical Structure
• Series of Breaks of Structure (BoS) confirming the bullish trend
• Price is currently sitting above the $125 4H demand zone, near previous highs
• Invalidation for the bearish thesis sits at $140
🧭 Strategy Outlook
If $125.50 fails:
→ Next demand: $113.00–$105.00
→ Below that: strong support zone at $98.00–$89.00
If $140 breaks and holds:
→ Bearish divergence invalidated
→ Continuation toward new highs likely
📌 Summary
Price is at an inflection point. Structure remains bullish, but momentum is weakening across higher timeframes and RSI divergence is still active.
Watching $125.50 as the trigger:
Below = potential sell-off
Above = stay patient

$PLTR ONCE IN A LIFETIME FIBONACCI PYRAMID LONG TERM Target 157NASDAQ:PLTR ONCE IN A LIFETIME FIBONACCI PYRAMID
LONG TERM Target 157 🎯
The 50% Golden ZONE held at 66.50 in APRIL with a MASSIVE ALGO STEPPING IN
I am looking for a new 6 figure play here ON DIP BUYS with leaps! I will alert all here
NO CHARGE just Drop a 👍for me!


PLTR eyes on $133.37 (again): Golden Genesis to BREAK this time?PLTR has made a round trip to our Golden Genesis.
Looking for a Break-and-Retest of this proven fib.
This time we should POP nicely after it breaks.
.
Full Frontal of its Genesis Fib:
See "Related Publications" for previous EXACT plots --------------->>>>>>>
.

Long Opportunity for Palantir Technologies: Next Week Trading InCurrent Price: $127.72
Direction: LONG
Targets:
- T1 = $131.80
- T2 = $135.00
Stop Levels:
- S1 = $125.50
- S2 = $122.90
**Wisdom of Professional Traders:**
This analysis synthesizes insights from thousands of professional traders and market experts, leveraging collective intelligence to identify high-probability trade setups. The wisdom of crowds principle suggests that aggregated market perspectives from experienced professionals often outperform individual forecasts, reducing cognitive biases and highlighting consensus opportunities in Palantir Technologies.
**Key Insights:**
Palantir Technologies (PLTR) exhibits mixed indicators, with short-term bearish momentum counterbalanced by solid long-term support from government contracts and fundamental strengths. Breaking resistance levels at $135 could trigger a shift in sentiment and enable further upward momentum, providing opportunities for long positions. Monitoring critical support zones and broader market activity is essential.
**Recent Performance:**
Palantir has recently shown signs of short-term weakness, retreating from a prior high of $137.90 and closing below last week's price of $131.78. This decline suggests hesitation among market participants while leaving room for potential recovery based on favorable technical setups.
**Expert Analysis:**
Analysts remain optimistic about Palantir’s long-term viability due to its sustained pipeline of government contracts, a distinct advantage within the tech sector. However, resistance at $135 remains a critical challenge for the stock to regain bullish sentiment and achieve higher targets. While current bearish movements hint at caution, broader support above major moving averages signals resilience.
**News Impact:**
No new headlines have been identified as immediate catalysts for price movement. However, Palantir's reliance on government contracts underpins its stability. Tracking developments tied to contract renewals or expansions will be essential for assessing the stock's performance trajectory.
**Trading Recommendation:**
Traders should consider a long position in Palantir Technologies, aiming for a breakout above $135 while maintaining disciplined stop-loss levels at $125.50 and $122.90. A shift in sentiment and positive momentum could enable the stock to achieve upside potential with targets at $131.80 and $135.00.

PLTR SL hitLoss Locked on NASDAQ:PLTR — Part of the Game 💸
I closed out a position on Palantir today for a loss. Why?
I listened to a gut feeling that the broader market was about to roll over… but it never did. The market proved me wrong, and I paid the price. That’s trading.
Key takeaway:
Stick to the plan, not the gut. Emotions can’t beat a well-tested strategy.
Losses are tuition. Review the trade, log the lesson, and keep grinding forward. On to the next setup. 💪
#PLTR #TradingJourney #LossesAreLessons #TraderMindset #StickToThePlan #RiskManagement #KeepGrinding #DisciplineOverEmotion

PLTR 479% Parabolic Rally Meets RSI Divergence at Critical ZonePalantir (PLTR) has completed a near-perfect parabolic advance, rising more than 479% over 378 days from its demand base in early 2024. The move has been relentless — supported by breakout volume and accelerating price structure.
However, we are now at a potential inflection point.
Price is stalling at the upper end of the parabolic curve, right near a prior rejection level. At the same time, the RSI has been forming multiple bearish divergences, signaling weakening momentum despite new highs.
This exact combination — parabolic rise + RSI divergence — has preceded sharp corrections in the past.
The previous drop from this region led to a -47% decline, which found support in the $70–75 zone — now marked as a 2D demand area. That zone could again act as a magnet if momentum fades.
If PLTR breaks above $135 with strong volume, the divergence could be invalidated, but for now, the chart suggests caution. This may be a topping structure or the start of a broad sideways range.

Palantir UpdateThere is a lot to unpack regarding Palantir based on what has transpired as of late. I have removed the possible smaller degree irregular abc pattern that I was tracking. If you draw fibs for what would be a sub-minuette wave i of (v), you see that our recent top was made right around the 1.236. This is very standard for ED's. Also, when it reversed, it did so with strength which is another trait of ED's.
MACD broke down below the trend line and has come back into the wedge. It appears to be weakening/curling, setting price up for a potential move down again. What I would like to see, is for MACD to remain under the upper trend line while resetting before dropping and pulling price back down with it. This would fit well with the white count. If this happens, then I believe the ensuing price action would reflect close to what I have laid out on white.
The ALT count, which is becoming less and less likely every day, is the yellow pattern. This suggests that we're within a larger degree irregular ABC pattern. If this is the case, then price would likely drop to the $65 area if not lower. I think this pattern is very low probability, but it could still happen so it will stay on the chart for now.
In short, I believe we have topped in an ED with the slim chance of getting one more slight high. If we have topped, we should be headed for the target box in a 3-wave fashion. This would be a great place for longs should the coming price action follow my predicted structure.

PLTR Bearish Swing Play – Trump Deal Fallout & Technical Breakdo📉 PLTR Bearish Swing Play – Trump Deal Fallout & Technical Breakdown
🗓️ Date: June 5, 2025
🧠 Strategy: Short-term momentum + sentiment swing
⏱️ Timeframe: 5–10 trading days
🔎 Multi-Model Analysis Summary
Model Bias Strike Entry Target Stop Confidence
Grok 🔻 Bearish 122 5.50 8.25 3.85 75%
Claude 🔻 Bearish 120 4.75 7.13 5.70 75%
Llama 🔻 Bearish 120 4.85 9.00 3.50 70%
Gemini 🔻 Bearish 120 4.80 9.00 3.50 70%
DeepSeek 🔻 Bearish 120 4.80 8.25 stock SL 75%
✅ Consensus: All models align on bearish momentum and bearish options flow
📉 Max pain + high open interest at $120 = gravitational magnet
🔻 Negative news on GOP scrutiny and Trump contract backlash → strong downside pressure
🧭 Technical & Sentiment Overview
Price Action: Below all major EMAs; 15m/daily charts breaking down
Momentum: MACD bearish cross, RSI oversold on 15m
Weekly Trend: Still bullish – could trigger mean-reverting bounce
Options Flow: Heavy OI at $120 puts, consistent sell pressure
Max Pain: $120 → bearish bias reinforced
News Flow: GOP/TikTok scrutiny, deal risk, broad tech pullback
✅ Recommended Trade Setup
Metric Value
Instrument PLTR
Direction PUT (Short)
Strike $122.00
Expiry 2025-06-20
Entry Price $5.60 (mid)
Profit Target $8.40 (+50%)
Stop-Loss $4.48 (-20%)
Position Size 1 contract
Confidence 75%
Entry Timing Market open
🎯 Trade Rationale
Aligns with cross-model agreement on direction and level
Captures max pain magnet at $120
Risk-managed with tight stop and defined 50% upside
Capitalizes on current negative news cycle + bearish technicals
⚠️ Key Risks to Watch
📈 Dead-cat bounce from oversold RSI on 15m
📉 Weekly trend still up — any bounce >$125 invalidates setup
🕓 Theta decay accelerates in week 2 → time-sensitive setup
🧾 News reversal or surprise PR from company can flip narrative fast

PLTR short move up $131PLTR has just move down with the news of supposed fears in market even tho' everything seems to be going up. It just capitalize on previous ORDB watching for a FVG close on the $131 and see where it goes from there.
There is a small gap at the $110 but to get there we need to see the movement after the FVG closure on top.
Keep your options ready.

