PLTR Weekly Options Outlook — June 1, 2025🚨 AI Consensus: Bullish Momentum with Caution on Short-Term Overbought Levels
🧠 AI Model Highlights
🔹 Grok (xAI)
Technicals: Strong uptrend, riding upper EMAs & Bollinger; RSI = 87.
Sentiment: VIX stable, bullish AI headlines; max pain at $122.
Trade: Buy $145C @ $0.88 → Target $1.06 (+20%), Stop $0.62 (−25%)
Confidence: 70%
🔹 Claude (Anthropic)
Technicals: Overbought on all frames; volume spike on red bars.
Sentiment: Positive news, but gravity toward $122.
Trade: Buy $120P @ $0.88 → Target $1.76 (+100%), Stop $0.44
Confidence: 75%
🔹 Gemini (Google)
Technicals: Bullish breakout; 5-min RSI hot, but daily trend intact.
Sentiment: Strong $145 call flow.
Trade: Buy $145C @ $0.88 → Target $1.54 (+75%), Stop $0.44
Confidence: 70%
🔹 Llama (Meta)
Technicals: Bullish daily, short-term overbought.
Sentiment: Bullish, but recommends waiting for pullback to $130–131.
Trade: No immediate entry; consider $132–133C later.
🔹 DeepSeek
Technicals: Bearish MACD cross; overbought RSI; resistance at $133.5.
Sentiment: Mixed flow; expects pullback.
Trade: Buy $125P @ $1.80 → Target double, Stop 50%, Size: 3
Confidence: 65%
✅ What They Agree On
📈 Strong rally across the board
⚠️ 5-min RSI > 85 = overbought condition
🧲 Max Pain at $122 = potential late-week gravity
📰 Bullish AI sentiment continues
🔄 Where They Disagree
🔺 Bulls (Grok, Gemini, Llama) favor calls, especially $145
🔻 Bears (Claude, DeepSeek) expect reversion to mean via puts
📆 Llama urges patience, others suggest open entry
🎯 Target gains range from 20% to 100%
🎯 Recommended Trade Setup
💡 Strategy: Bullish Naked Call
🔘 Ticker: PLTR
🔀 Direction: CALL (LONG)
🎯 Strike: $145
💵 Entry Price: $0.88
🎯 Profit Target: $1.54 (+75%)
🛑 Stop Loss: $0.44 (−50%)
📏 Size: 1 Contract
📆 Expiry: 2025-06-06 (Weekly)
⏰ Entry: At Market Open
📈 Confidence: 70%
⚠️ Risk Factors to Monitor
RSI overheated — watch for early week pullbacks
Max pain at $122 could drag later in week
Time decay (theta) rises sharply after Wednesday
Negative macro or AI-related headlines could reverse flow
📊 TRADE DETAILS (JSON)
json
Copy
Edit
{
"instrument": "PLTR",
"direction": "call",
"strike": 145.0,
"expiry": "2025-06-06",
"confidence": 0.70,
"profit_target": 1.54,
"stop_loss": 0.44,
"size": 1,
"entry_price": 0.88,
"entry_timing": "open",
"signal_publish_time": "2025-06-01 15:47:31 UTC-04:00"
}
PLTR trade ideas
PLTR still bullish - Cup n Handle patternPLTR in Cup and handle pattern, broke out.
The price closed on Friday is $131.78 (05.30.2025).
Desired entry price $127.88.
Target $147.58/ 164.99/ 183.41.
Stop loss $119.41.
IMO.

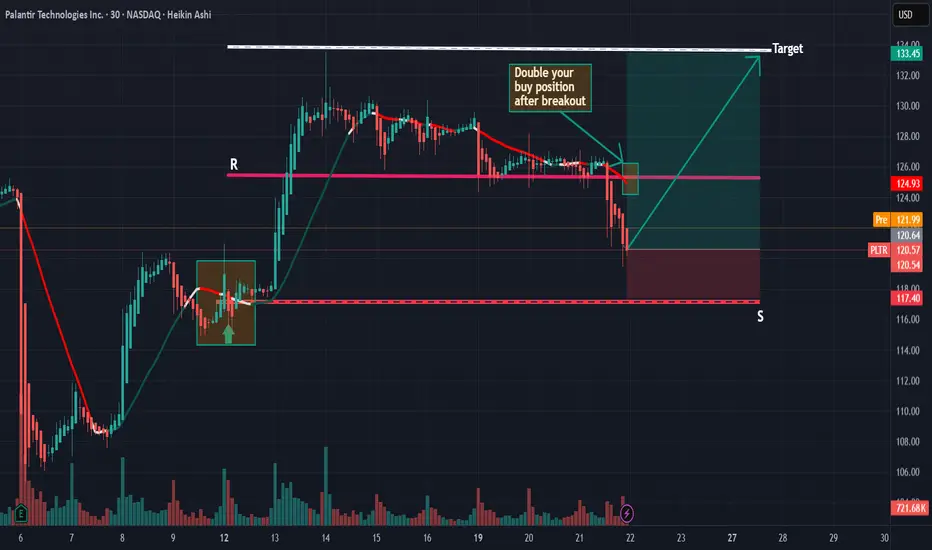
[PLTR] break out trendline set up (daytrading) On the H1 chart, we can see a breakout of the downtrend line followed by a retest — a sign that the uptrend is continuing.
I opened a call option near last trading hour today, depending on what I feel comfortable with tmr i would close the position
I won’t hold overnight since the option expires this week.

PLTR – Breakout Setup in Motion🔹 Buy Entry: $131 - 132
🔹 Stop Loss: $120.80
🔹 Current Price: $131.78
🔹 Target (1:3 R-multiple): ~$162.80
🔹 Risk/Reward: Strong – clear breakout from tight range with increasing volume.
🟢 Why This Trade?
• Clean breakout above prior highs with strong momentum (+7.73%)
• High volume confirmation
• Supportive moving averages stack (20EMA > 50MA > 200MA)
• One of the strongest setups in the sector
• Strong institutional backing & tech tailwind
DISCLAIMER : The content and materials featured are for your information and education only and are not attended to address your particular personal requirements. The information does not constitute financial advice or recommendation and should not be considered as such. Risk Management is Your Shield! Always prioritise risk management. It’s your best defence against losses.

Palantir Goes to Repeat Tycoon Buffett Early 1990s AchievementSomewhere in another Galaxy, in late December, 2024 (yet before The Second Coming of Trump), @TradingView asked at it awesome Giveaway: Happy Holidays & Merry Christmas.
1️⃣ What was your best trade this year?
2️⃣ What is your trading goal for 2025?
Here's what we answered:
1️⃣ What was your best trade this year?
- Surely Palantir NASDAQ:PLTR 💖
I followed Palantir all the year since January, 2024, from $16 per share, watch here .
Current result is 5X, to $80 per share.
Also I added more Palantir after SP500 Index inclusion in September 2024 watch here .
Current result is 2.6X, from $30 to $80 per share.
2️⃣ What is your trading goal for 2025?
- Once again, surely Palantir NASDAQ:PLTR 💖
It's gone 4 months or so... (Duh..? Ahaha.. 4 months, really? 😸😸😸)
Let see what's happened next at the main graph PLTR/SPX
First of all, let me explain in a few words what does this graph mean.
Rising (Blue) candle means Palantir NASDAQ:PLTR monthly return is better vs SPX
Falling (Red) candle means Palantir NASDAQ:PLTR monthly return is worse vs SPX
Conclusion
Palantir. The stock that outperformed S&P 500 Index, 11 consecutive months in a row.
Palantir. The stock that printed 11x since inception. 5.5x over the past twelve month and 1.5x in the year 2025 (the best one result so far over the all S&P 500 Index components).
Palantir. The stock that goes to repeat Tycoon Buffett achievement early 1990s (in 1992-93 Berkshire Hathway outperformed S&P 500 Index for a straight TWELVE MONTHS.
Palantir. Were we right with this stock on contest and won it? Exactly! Even though our prize has been toadly strangled. 🤭
--
Best wishes,
Your Beloved @PandorraResearch Team 😎

HIMS 20SMA Trend Contiuation PULLBACK SETUP NYSE:HIMS – Momentum Reload at 20 SMA After Massive Run
NYSE:HIMS has been one of the hottest stocks in the market, and it’s giving us a textbook trend continuation pullback setup — right into the sweet spot.
🔹 Pullback to the 20 SMA
• After a huge run, NYSE:HIMS finally gave us a controlled pullback to the 20 SMA, where it based for multiple days.
• Today, it remounted the 9 EMA — a key trigger in my swing strategy for momentum re-entry.
🔹 Why This Setup Works
• Momentum names don’t stay down long — this was just a reset.
• Even with the market shaky today, NYSE:HIMS closed strong — up 8% while the rest of the tape faded.
• This setup is all about getting back into strength with low risk.
My Trade Plan:
1️⃣ Entry: Took a position on today’s remount of the 9 EMA.
2️⃣ Stop: Just under the 20 SMA — tight, well-defined risk.
3️⃣ Target: First target is a move back into the previous highs — if it breaks, we trail for continuation.
🧠 This is my bread-and-butter swing entry — clean, controlled, and full of momentum potential.

PLTR Flag Breakout Near ATHSmall catalyst today. It sold off on it at the open and quickly took out its opening range. Ive added a position here in the 126s with a stop at the low of the day.
We have a nice flag pattern. With a ton of support at the 20sma.
We have dipped now multiple times into the 9/20 zone (shaded area) and its been absorbing each time.
This is a bullish sign its had multiple times where it looked like it could sell off only to get bought up.

PALANTIR I Liquidity below 78 and OB. Target 160The liquidity cycle is not on, so I expect another pump will form soon.
Palantir Fundamentals in Brief
📍Innovative Tech & Diversified Base:
Palantir’s platforms—Foundry and Gotham—enable organizations to integrate and analyze large datasets, offering actionable insights. Their services span both government agencies and commercial enterprises, helping balance revenue risks.
📍Solid Financial Momentum:
The company’s consistent growth and its focus on long-term contracts highlight a path toward greater operational efficiency and profitability. Their commitment to multi-year engagements builds a reliable foundation for future expansion.
📍Investment Thesis:
In an era where data drives decision-making, Palantir’s cutting-edge technology positions it as a key player in digital transformation. Its resilience in adapting to market changes and a steady stream of contracts make it an attractive option for investors looking for a forward-thinking tech play.
This analysis underscores why many consider Palantir a compelling long-term investment, blending technological innovation with a strategic approach to market challenges.
Its ecosystem withing Ecosystem
What they are doing is unique, so now we might ask why other big tech companies are not doing the same. Well, here is my thesis, they nailed the specific sector.
Can Ford or Rivian be like NASDAQ:TSLA in EVs and FSD? No
Can Linux be like NASDAQ:MSFT Windows and Office? No
Can Microsoft Edge be like NASDAQ:GOOGL Chrome? No
Can AMD be like NASDAQ:NVDA ? No
Can Walmart be like NASDAQ:AMZN in E-commerce and Fulfillment? Nope
But that's not all
Peter Thiel, Palantir &PayPal co-founder, has been a mentor and major financial supporter of J.D Vance. Their relationship began around 2011 when Vance attended a talk by Thiel at Yale Law School, which inspired Vance to pivot his career away from law. Vance joined Thiel's global investment firm in 2017 and later worked at Thiel's venture capital firm, Mithril Capital. Thiel played a crucial role in Vance's political rise by donating $15 million to Vance's 2022 Senate campaign. This financial support helped Vance secure his victory. Thiel introduced Vance to former President Donald Trump, leading to Trump's endorsement of Vance for the Senate
His web of power is huge
Clark Minor, a 13-year Palantir veteran, is now RFK Jr.’s Health & Human Services Chief Information Officer.
Gregory Barbaccia, Palantir's former Head of Intelligence and Investigations, was hired as Federal Chief Information Officer
Jacob Helberg, a senior advisor to Palantir, was appointed as the Under Secretary of State for Economic Growth, Energy, and the Environment
Shyam Sankar, Palantir’s Chief Technology Officer is reportedly being considered for a high-level Pentagon job guiding research and development
Anthony Jancso, George Cooper and one other engineers have been associated with DOGE recruitment effort ,and they are former Palantir Forward Deployed Engineers
Greg Little, one of the first Pentagon officials to run CDAO, joined Palantir as a senior counselor in August 2023.
David Spirk, who served as chief data officer at the Pentagon and contributed to the creation of CDAO, joined Palantir as senior counselor in July 2022.
Maura Thompson, who held various logistics positions at CDAO and the Joint Chiefs of Staff, is now a deployment strategist at Palantir.
Trevor Austin, who worked as a Palantir engineer early in his career, is now CDAO’s acting chief technology officer.
Will Thibeau, who worked as deployment strategist at Palantir, later did a stint at CDAO as a policy analyst.
Joseph Larson, who headed AI policy and strategy at Palantir, went on to serve as a deputy chief at CDAO.
Matthew Turpin, an advisor to Palantir, served as the director of China for the National Security Council in the first Trump White House and as senior China advisor to Trump’s then-commerce secretary
Wendy Anderson, an executive with Pentagon experience who joined the company in 2020, holds the title of senior vice president of federal and national security.
Alexander Alden, a veteran of the first Trump administration who joined Palantir in 2021. Described as a “Trump loyalist,” Alden served as a special assistant at the Pentagon from 2017 to 2018 before becoming senior director on Trump’s National Security Council, responsible for emerging technologies and defense policy.
Jamie Fly, a former aide to Sen. Marco Rubio (R-Fla.), Trump’s newly installed secretary of state. Fly served as a foreign and national security affairs advisor to Rubio from 2013 to 2017 and did an earlier stint in the George W. Bush administration at both the Pentagon and National Security Council. He joined Palantir in August 2023.
Geof Kahn, a Central Intelligence Agency veteran who worked on the transition team for the first Trump administration, assisting then-Rep. Mike Pompeo (R-Kan.) during his confirmation process to be CIA director. Kahn later served as senior adviser to Pompeo and the CIA’s chief operating officer. He previously spent five years as policy director for the House Intelligence Committee from 2011 to 2017. Kahn joined Palantir in January 2023.
--Palantir Federal Advisory Board Members
The Honorable Christine H. Fox - Former Acting Deputy Secretary of Defense and Former Assistant Director, Policy and Analysis, Johns Hopkins University Applied Physics Laboratory.
General Carter F. Ham, USA (Retired) - Former Commander, United States Africa Command, and Former President and CEO of the Association of the United States Army.
The Honorable Deborah Lee James - Former Secretary of the United States Air Force.
Admiral William H. McRaven, USN (Retired) - Former Commander, United States Special Operations Command, and Former Chancellor of the University of Texas.
Vice Admiral Peter V. Neffenger, USCG (Retired) - Former Vice Commandant of the United States Coast Guard, and Former TSA Administrator, United States Department of Homeland Security.
The Honorable Jeh C. Johnson - Former Secretary of Homeland Security at the Department of Homeland Security and Counselor to Palantir.
Dr. Deborah L. Birx - Former Coordinator of the White House Coronavirus Task Force, and Former Ambassador-at-Large of the President’s Emergency Plan for AIDS Relief (PEPFAR).
The Honorable Will Hurd - Former Representative of Texas' 23rd District.
General Gustave F. Perna, USA (Retired) - Former Chief Operating Officer, Operation Warp Speed; Former Commander, Army Materiel Command (AMC), U.S. Department of Defense.
Mr. Greg Simon - Former Executive Director of the White House Cancer Moonshot Task Force and the Biden Cancer Initiative, and Co-Founder of the Melanoma Research Alliance.
Im looking forward to the constructive discussion and also looking forward to the hatters. You are all welcome.
David Perk

Quick View: $PLTR- Bullish flag on the hourly chart
- Bullish scenario on the daily chart
- Volume is decreasing
Area of $134 as key resistance.
Support → $118

PLTR Update My previous post on PLTR hinted at altitude exhaustion under the dome.
Today, a possible abandoned baby forms, adrift at the top of the dome.
Nothing confirmed yet.
But when candles get left behind, they often aren’t rescued.
With NVDA earnings and FOMC minutes tomorrow, the market may reveal its true posture:
Are we in a climb… or simply hovering before descent?
I’m watching 125.05 and 119.90 as silent checkpoints.
If they fail, the dome narrative resumes.
Patience. Observation. Stillness.
Let the tape speak first.

Long Position as AI Growth Accelerates
Targets:
- T1 = $128.00
- T2 = $132.50
Stop Levels:
- S1 = $119.00
- S2 = $112.50
**Wisdom of Professional Traders:**
This analysis synthesizes insights from thousands of professional traders and market experts, leveraging collective intelligence to identify high-probability trade setups. The wisdom of crowds principle suggests that aggregated market perspectives from experienced professionals often outperform individual forecasts, reducing cognitive biases and highlighting consensus opportunities in Palantir Technologies.
**Key Insights:**
Palantir Technologies remains at the forefront of artificial intelligence and big data analytics. Its high-profile government contracts and partnerships highlight a strong moat in the defense and intelligence sectors. Traders note its growing influence in commercial operations as companies expand their reliance on AI-driven predictive insights. Despite trading at a premium valuation, Palantir's positioning in critical industries such as national security and commercial AI adoption underscores its long-term growth potential. Furthermore, its inclusion in the S&P 500 has garnered increased visibility and liquidity from institutional and retail investors alike.
The company's ability to innovate and monetize its AI capabilities has kept investors engaged, especially as the global demand for advanced analytics surges. However, heightened valuation concerns amidst broader market volatility could introduce near-term swings. The $125.50 resistance level is critical — breaking above it could catalyze a fresh rally.
**Recent Performance:**
Palantir's stock has been consolidating within a tight range near all-time highs, supported by robust demand for AI-powered solutions and high-profile commercial wins. The inclusion of Palantir in the S&P 500 has helped sustain bullish momentum, with upward market moves closely aligned to global defense spending and technological adoption trends. Its gradual climb remains accompanied by consistent volatility, serving as an opportunity for both momentum and swing traders.
**Expert Analysis:**
Analysts uniformly agree on Palantir's growth trajectory being tied to AI monetization and defense innovation. Long-term shareholders highlight its role as a strategic player in critical industries, while traders see the current price action as offering a favorable risk-reward setup, particularly with the AI sector signaling sustained momentum. While valuation remains elevated compared to peers, the bullish narrative leans heavily on future revenues from defense contracts and European expansion, especially given geopolitical uncertainties that necessitate advanced analytics.
**News Impact:**
Recent global developments, including increased defense budgets and heightened interest in AI-driven platforms, have bolstered Palantir's market positioning. European countries adopting advanced analytics tools for defense and manufacturing have widened Palantir's growth runway. Its manufacturing OS designed to streamline operations amidst tariff and supply chain complexities highlights its innovation in addressing global economic challenges. Bolstered by institutional support, including significant stakes held by BlackRock, the stock's inclusion in the S&P 500 further amplifies its long-term visibility.
**Trading Recommendation:**
Given its positive market positioning and sustained bullish sentiment, a LONG trade on Palantir appears well-founded. The $125.50 resistance level is pivotal — a breakout could open the path to T1 ($128.00) and T2 ($132.50). Traders should carefully monitor $119.00 and $112.50 as stop-loss levels, ensuring the trade remains favorable in events of downside risk. While the valuation might limit broader institutional growth, Palantir's dominance in AI-powered analytics signals a strong upside potential for the near term.

PLTR: Potential for Further Upside in H2 2025Price is showing a constructive, low-volume pullback into rising EMAs - a healthy sign within an ongoing uptrend as long as price is holding above 118-110 support zone.
Daily trend structure:
Macro trend structure (Weekly):
Thank you for your attention and I wish you successful trading decisions!

PLTR Fails The BreakoutI've been a bag holder of NASDAQ:PLTR from $9. Don't give me too much credit; I bagheld down to $6. I still have the shares but as it makes an attempt to break the prior All Time High this week will close in failure = bearish.
When price makes a shot to a new major high or especially new ATH its of utmost importance that it follow through. You need that reckless YOLO abandon of buyers willing to buy the new highs and give a solid closing price for the Week above what was the prior ATH. That failing to happen is the most bearish of signals.
To that end; Puts... I consider them hedges on my shares taken out to August (for next earnings).

Palantir: The Wisdom of the TrimEvery bull run carries within it the seed of its own rebalancing.
Palantir (PLTR) has ridden the wave of AI narrative, defense tailwinds, and a well-timed alignment with rising geopolitical risk. The market responded accordingly: momentum. Volume. Euphoric belief.
But here we are.
a) Valuation at historically stretched P/E levels—difficult to sustain unless earnings catch up fast.
b) Insider sales quietly ticking higher—rarely a conviction vote.
c) Enterprise demand rising, yes, but already priced in. Corporate contracts no longer come as a surprise; instead, they meet established expectations.
This isn't a bet against the mission. Palantir's pricing aligns with the fragmented, contested, and algorithmic world we're entering.
But... pricing something correctly for wartime does not mean it's immune to peacetime profit-taking.
Technically, the arc is bending. Below the dotted roofline, there is a gentle roll. Support zones await below.
The wise take partials not because they’re bearish...
But because they understand gravity.
Trim the position. Not the conviction.
...

Palantir Technologies (PLTR) Shares Pull Back from Another HighPalantir Technologies (PLTR) Shares Pull Back from Another High
Shares in Palantir Technologies (PLTR), a company specialising in big data analytics software, have seen phenomenal growth in 2024, surging by approximately 340%, making it the top performer in the S&P 500 (US SPX 500 mini on FXOpen). This exceptional performance was driven by booming demand for artificial intelligence (AI) and machine learning technologies, which underpin Palantir’s products. The company has demonstrated steady growth in revenue and profitability, attracting major new clients across both the commercial and government sectors.
In 2025, PLTR remains among the market leaders, with its share price up roughly 60% year-to-date. In mid-May, it hit a fresh record high on the back of a strong fundamental backdrop. That backdrop was bolstered yesterday by news that the Pentagon had increased funding for its Maven Smart System programme — which involves deploying AI on the battlefield — to $1.3 billion through to 2029.
However, this news did not result in a new high. In fact, this week, PLTR stock have underperformed the broader stock market — and this may be explained by technical analysis.
Technical Analysis of the PLTR Chart
The interplay of supply and demand in 2025 has formed a broad ascending channel, characterised by:
→ The price breaking above the upper boundary in February following a strong earnings report, and dipping below the lower boundary in response to Donald Trump’s announcement of new international trade tariffs.
→ In mid-May (as shown by the arrow), the median line acted as support. However, after reaching the upper boundary, bullish momentum faded. As a result, the PLTR price has failed to hold recent highs and has fallen back below $130 — with market participants seemingly viewing the stock as overvalued, evidenced by false breakouts above previous peaks.
Given the above, it is reasonable to assume that PLTR may undergo a deeper pullback — potentially towards the median of the channel or even its lower boundary.
This article represents the opinion of the Companies operating under the FXOpen brand only. It is not to be construed as an offer, solicitation, or recommendation with respect to products and services provided by the Companies operating under the FXOpen brand, nor is it to be considered financial advice.

PLTR - Consolidation before run or ready to fall ?Lots of short setups have started to appear and unfold those last 2-3 days, like NASDAQ:AAPL , $V, NASDAQ:CROX , NYSE:RDDT , etc. this could indicate that the "90 day Tariff truce" rally is coming to an end.
NASDAQ:PLTR made a nice break lower yesterday but today's rise seems for now like a counter trend move.
So, I'm playing this very simple:
As long as price is below 125.45$, I'm holding a short position.
A convincing break above that level, increases chance that this breakout might take this higher, so look for long setups.

PLTR: Reversal trendOn PLTR we can see that we are in a bearish trend with a succession of many red candles also accompanied by many red volumes. On top of that we are below the vwap indicator. This implies that we must be careful and vigilant. Indeed, given this chart configuration we would have a high probability of having a reversal of the trend (bullish trend). This will be confirmed by the strong break of the resistance line as well as the vwap indicator by a large green candle and followed by a large green volume.
PLTR WAIT FOR THE CRACK!The double top is complemented with a bearish rising wedge stuck in a rising bearish F flag.
A straightforward, short setup if you wait for the CRACK!

PLTR, It's Been RealAt a high of 125, it's had a great run, but a double top has formed going into earnings and a US government which may be forced into austerity. Insiders have been selling for months with no net buys
- First Price target down to the neckline at 76
- Next price target would be 42 for the last real breakout test
- Final PT would be 24 if the double top played out completely

Potential W PLTRWeekly has a double top formation but if it can survive and not retrace much more than 30-40% from the top it could play out a W pattern which is one of the most bullish around

PLTR – Flag Breakout Above All-Time HighsPalantir is printing a bullish flag pattern right above its all-time highs — this is a textbook continuation setup that often leads to explosive upside.
🔹 After a strong breakout to ATHs, NASDAQ:PLTR has been consolidating in a tight range — a healthy pause.
🔹 Flags that form above prior resistance often act as launchpads when volume comes in.
🔹 Break over the flag highs could open the door to a new leg higher.
Setup Notes:
Watching for a breakout over the flag with volume confirmation.
Tight stop under the flag base keeps risk defined.
Price action remains bullish as long as it holds above previous ATHs.
🧠 This is one of my favorite setups — strong stock, strong base, strong trend.
this is the first pull after this initial thrust. The pullback has been boring and orderly too which i think is bullish for the stock


$PLTR Tradespoon – Long Entry $126.55Tradespoon model generated long signal for NASDAQ:PLTR . Predicted range: $126.55–$134.02. Trend: +0.62%. NASDAQ:PLTR
