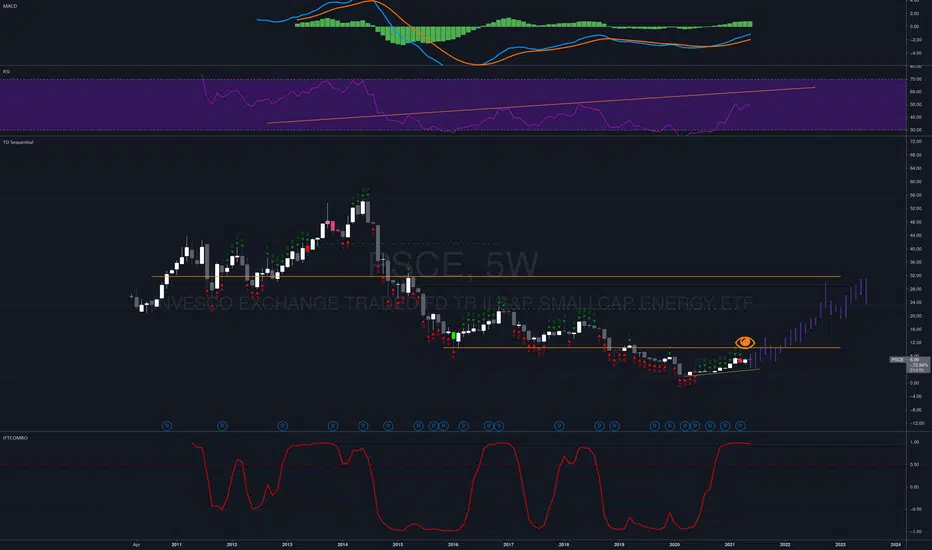
PSCE - Long to $18-20 areaPSCE - Long to $18-20 area
Break the triangle edge and continue the movement to $18-20 area
Key stats
About Invesco S&P SmallCap Energy ETF
Home page
Inception date
Apr 7, 2010
Structure
Open-Ended Fund
Replication method
Physical
Dividend treatment
Distributes
Distribution tax treatment
Qualified dividends
Income tax type
Capital Gains
Max ST capital gains rate
39.60%
Max LT capital gains rate
20.00%
Primary advisor
Invesco Capital Management LLC
Distributor
Invesco Distributors, Inc.
PSCE represents the energy segment of the S&P SmallCap 600, a market-cap-weighted index that consists of US small-cap companies screened for size, liquidity, and financial viability. The fund holds a concentrated portfolio of small-cap energy firms, which may include those involved in oil & gas exploration and production, refining, oil services, as well as pipelines. Selected securities are weighted by market cap and are constrained at each quarterly rebalance, such that individual securities will not exceed 22.5% weight and the aggregate weight of securities with over 4.5% allocation is capped at 45% weight of the portfolio. Overall, PSCE is an exclusive, small-cap play in the US energy sector.
Related funds
Classification
What's in the fund
Exposure type
Energy Minerals
Industrial Services
Transportation
Stock breakdown by region
Top 10 holdings

PSCE Long ViewThis idea is for me, this is not financial advice.
20% confidence in this playing out.
w00f

PSCE - Getting Alpha on US Oil and Nat Gas. Up trend strong, pull backs seem to be respecting fibs which only tells me that there is possibly professional buying interest. Economic stage fits a good backdrop. USO etf is almost too heavily traded imo opinion, and it gets muted returns because of the size of the fund inflows and outflows. Also

PSCE 06/09/2021Daily and Monthly money flow looks convincing,
are market going for another bullish run?

See all ideas
Summarizing what the indicators are suggesting.
Oscillators
Neutral
SellBuy
Strong sellStrong buy
Strong sellSellNeutralBuyStrong buy
Oscillators
Neutral
SellBuy
Strong sellStrong buy
Strong sellSellNeutralBuyStrong buy
Summary
Neutral
SellBuy
Strong sellStrong buy
Strong sellSellNeutralBuyStrong buy
Summary
Neutral
SellBuy
Strong sellStrong buy
Strong sellSellNeutralBuyStrong buy
Summary
Neutral
SellBuy
Strong sellStrong buy
Strong sellSellNeutralBuyStrong buy
Moving Averages
Neutral
SellBuy
Strong sellStrong buy
Strong sellSellNeutralBuyStrong buy
Moving Averages
Neutral
SellBuy
Strong sellStrong buy
Strong sellSellNeutralBuyStrong buy
Displays a symbol's price movements over previous years to identify recurring trends.
Frequently Asked Questions
An exchange-traded fund (ETF) is a collection of assets (stocks, bonds, commodities, etc.) that track an underlying index and can be bought on an exchange like individual stocks.
PSCE trades at 40.97 USD today, its price has fallen −1.37% in the past 24 hours. Track more dynamics on PSCE price chart.
PSCE net asset value is 40.97 today — it's risen 4.29% over the past month. NAV represents the total value of the fund's assets less liabilities and serves as a gauge of the fund's performance.
PSCE assets under management is 63.23 M USD. AUM is an important metric as it reflects the fund's size and can serve as a gauge of how successful the fund is in attracting investors, which, in its turn, can influence decision-making.
PSCE price has risen by 4.91% over the last month, and its yearly performance shows a −23.06% decrease. See more dynamics on PSCE price chart.
NAV returns, another gauge of an ETF dynamics, showed a 15.96% increase in three-month performance and has decreased by −21.63% in a year.
NAV returns, another gauge of an ETF dynamics, showed a 15.96% increase in three-month performance and has decreased by −21.63% in a year.
PSCE fund flows account for −79.59 M USD (1 year). Many traders use this metric to get insight into investors' sentiment and evaluate whether it's time to buy or sell the fund.
Since ETFs work like an individual stock, they can be bought and sold on exchanges (e.g. NASDAQ, NYSE, EURONEXT). As it happens with stocks, you need to select a brokerage to access trading. Explore our list of available brokers to find the one to help execute your strategies. Don't forget to do your research before getting to trading. Explore ETFs metrics in our ETF screener to find a reliable opportunity.
PSCE invests in stocks. See more details in our Analysis section.
PSCE expense ratio is 0.29%. It's an important metric for helping traders understand the fund's operating costs relative to assets and how expensive it would be to hold the fund.
No, PSCE isn't leveraged, meaning it doesn't use borrowings or financial derivatives to magnify the performance of the underlying assets or index it follows.
In some ways, ETFs are safe investments, but in a broader sense, they're not safer than any other asset, so it's crucial to analyze a fund before investing. But if your research gives a vague answer, you can always refer to technical analysis.
Today, PSCE technical analysis shows the buy rating and its 1-week rating is neutral. Since market conditions are prone to changes, it's worth looking a bit further into the future — according to the 1-month rating PSCE shows the sell signal. See more of PSCE technicals for a more comprehensive analysis.
Today, PSCE technical analysis shows the buy rating and its 1-week rating is neutral. Since market conditions are prone to changes, it's worth looking a bit further into the future — according to the 1-month rating PSCE shows the sell signal. See more of PSCE technicals for a more comprehensive analysis.
Yes, PSCE pays dividends to its holders with the dividend yield of 2.31%.
PSCE trades at a premium (0.00%).
Premium/discount to NAV expresses the difference between the ETF’s price and its NAV value. A positive percentage indicates a premium, meaning the ETF trades at a higher price than the calculated NAV. Conversely, a negative percentage indicates a discount, suggesting the ETF trades at a lower price than NAV.
Premium/discount to NAV expresses the difference between the ETF’s price and its NAV value. A positive percentage indicates a premium, meaning the ETF trades at a higher price than the calculated NAV. Conversely, a negative percentage indicates a discount, suggesting the ETF trades at a lower price than NAV.
PSCE shares are issued by Invesco Ltd.
PSCE follows the S&P Small Cap 600 / Energy -SEC. ETFs usually track some benchmark seeking to replicate its performance and guide asset selection and objectives.
The fund started trading on Apr 7, 2010.
The fund's management style is passive, meaning it's aiming to replicate the performance of the underlying index by holding assets in the same proportions as the index. The goal is to match the index's returns.