More Pain Coming! NASDAQ:PTON
People Lie, CNBC Lies, Charts Don’t.... Buy if you want to lose some money. PUTS!!!
PTON trade ideas

Path Prediction for PTON before/after Earnings CallI think the market overreacted a little to the news of PTON recalling treadmills and believe that PTON will rise up to the neckline of the Head and Shoulders pattern (refer to my last two posts) before crashing down. The stock is oversold on the 1H chart, along with the 1D chart and will be rising back into the BB channel in a few hours, most likely. I believe PTON will beat earnings estimates tomorrow, giving it the short boost that will propel it back to the neckline. Upon resistance rejection, the share price will drop and the short opportunity will hopefully present itself.
I will keep this and my last post updated with my current position on the stock. Happy trading, everyone!

Now we knowBased on our previous post, we can assume that H&S will be in the play and we are looking for further downside on this. Any upward movement would help to build a good short position.

$PTON is a cyphercypher harmonic pattern:
AB=0.38 XA
BC=1.42 AB
tp1=1.27 BC=$76
tp2=0.78 XA=$60
tp3=2 BC=$48


$PTON going for the biggest volcano eruption Short on any bounces 90-100 for financial freedom!
T1: 80
T2: 72
T3: 65
T4: 55-60


PTON sell Head and shoulders pattern shown reversal in the trend. Starts with a bearish engulfing candle with subsequent confirmation candles of the downtrend. Consolidates and gravestone doji signals another bearish move to the downside. Price has broken the support level to confirm the head-and-shoulder pattern for a further downside move.


PTON LongDemand Zone Below Support line
RSI Divergence
MACD Divergence
Today 4:30 PM ET, Earning
Entry 83
Stop 76
Target 100
I am not a PRO trader. I trade option to test my trading plan with small cost.
The max Risk of each plan should be less than 1% of an account.

PTON could be headed to $35Exercise fads never last. PTON is no exception. With the world re-opening, people want to go outside again and exercise outside (just my opinion).
Looks like a massive head and shoulders topping pattern, with potential targets of $70, $50, and $35.
Do your own research, this is not investment advice

Peloton potential short opportunity A great run for Peloton but after breaking an aggressive uptrend late February it looks like it could be forming a huge Head & Shoulders pattern. The price has corrected up to the 38.2 Fibonacci level after this years drop from the highs seen at the end of 2020. Potential short back down the neckline and support around 95.


Head and Shoulders/Ugly TopThis pattern does not perform well in a bull market, and performs best in a bear market.
Some would just call this an ugly top, or a complex head and shoulders pattern, as there are multiple shoulders. The complex variety can have multiple heads and/or multiple shoulders.
This is a tall structure. The neckline is a source of Strong support until it is broken with conviction.
PTON has pierced the support of the neckline, but was a brief piercing and price is now floating above the neckline. The pattern is not valid unless neckline is broken and a downtrend is in place. The neckline can be horizontal or it may slope.
Head and shoulder tops are reversal patterns so there needs to be a prior uptrend to reverse.
I would be very, very, very safe if I were in this long right now. These patterns can have pull backs (pull ups), a break back up can be a pull back in a downtrend. Good to be careful if you are long or thinking of going long and you see an ugly top.
I have noted that in a lot of cases, securities go down much slower than they go up. In other cases they drop like a bomb, but can stay in recovery mode down at the bottom for a very long time requiring patience that is hard for me sometimes. But I am working on it (o:
No recommendation.
I reposted this for clarification. Go with your gut (o:

PTON at Crucial Support Level Ahead of Earnings!A week ago, I posted a short idea on PTON with the Head and Shoulders pattern as my reasoning. That idea is still active, but I will be looking to this week's upcoming earnings call for confirmation of the pattern. The neckline of the pattern (~$95) is a critical support level and the earnings call will ultimately choose the direction in which the stock will proceed for the upcoming month(s). As of right now, the earnings call could go either way, but I am leaning more towards PTON falling short of expectations. If the earnings call is able to pull the price down below the neckline, then I will most likely open a short position on the stock. If the earnings call pushes the price above the right shoulder's peak, then I may or may not be looking to enter a long position. My decision on the long position will depend on how well PTON is able to resolve the issues that have risen around the country involving their treadmills.
I will update this idea with my position on this idea and stock after the earnings call on May 6, 2021 after-hours.

Head and Shoulders/Ugly TopThis pattern does not perform well in a bull market, and performs best in a bear market.
Some would just call this an ugly top, or a complex head and shoulders pattern, as there are multiple shoulders. The complex variety can have multiple heads and/or multiple shoulders.
This is a tall structure.
PTON has pierced the support of the neckline, but was a brief piercing and price is now floating above the neckline. The pattern is not valid unless neckline is broken and a downtrend is in place. The neckline can be horizontal or it may slope.
Head and shoulder tops are reversal patterns so there needs to be a prior uptrend to reverse.
I would be safe going long right now. These patterns can have pull backs (pull ups), a break back up can be a pull back in a downtrend. Good to be careful if you are long or thinking of going long and you see an ugly top.
No recommendation.
Possible Targets 1 46.4 33.5

$PTON 7 Months Head & Shoulders TopWith earnings this upcoming week, its sink or swim time for Peloton with potential 7 months head and shoulders top.
Stock is in a serious risk of entering stage 4 distribution phase. A decisive break of neckline support around $95 should confirm the breakdown. Subsequently, a decisive close back over $125 (above right shoulder), should re-affirm the stock uptrend and trigger the next leg higher.


PTON Peloton at critical support zoneIf Peloton is at critical support zone, I would expect a huge drop if it breaks through. Of course, it can bounce. Either way, it should be on your watch list.

PTON needs a miraclePTON in critical condition, in my eyes. Fallen through long term support lines, 200 day SMA, and dosent seem undeterred to tick longer.
Out of this world earnings might be the only thing to stop this ol' beast slumping further.

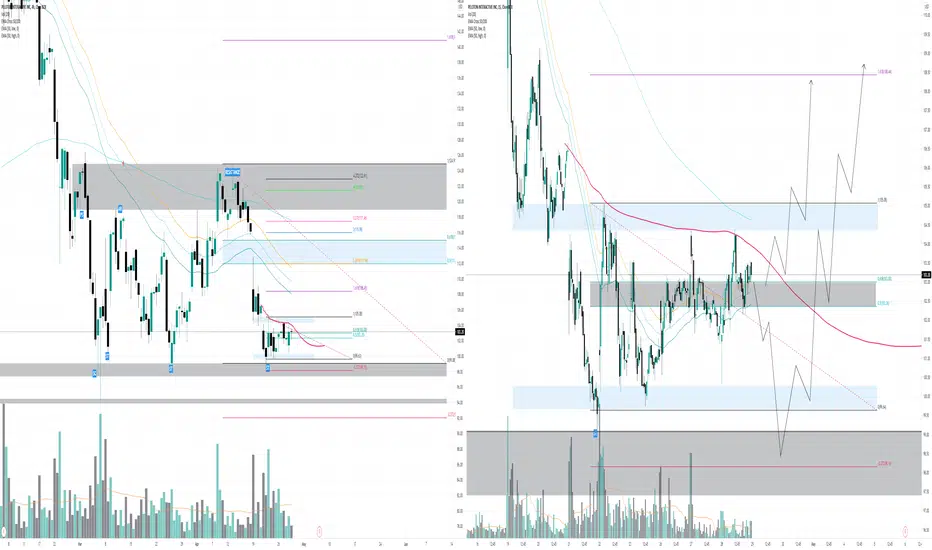
PTONPton is currently in phase 3 of Wycoff accumilation. Spotting accumilation on lower timeframes, building momentum for long term holds if we can get a proper jump of creek/ retest of 61.8 trading range zone.
I expect another dip in price to test trading range support one more time to build enough demand to push through creek. Now,.
IF we jump creek now due to buyers and sign of strength, Expect it to close bullish on the day above creek, come back down to retest that creek/61.8 level and start scaling buys to ride for the trading range resistance- Look for PS(Preliminary Support)
Overall, I see PTON making a good move to the upside here within the next month.