QQQ Massive Short! SELL!
My dear followers,
This is my opinion on the QQQ next move:
The asset is approaching an important pivot point 566.35
Bias - Bearish
Safe Stop Loss - 567.41
Technical Indicators: Supper Trend generates a clear short signal while Pivot Point HL is currently determining the overall Bearish trend of the market.
Goal - 564.18
About Used Indicators:
For more efficient signals, super-trend is used in combination with other indicators like Pivot Points.
Disclosure: I am part of Trade Nation's Influencer program and receive a monthly fee for using their TradingView charts in my analysis.
———————————
WISH YOU ALL LUCK
QQQ trade ideas
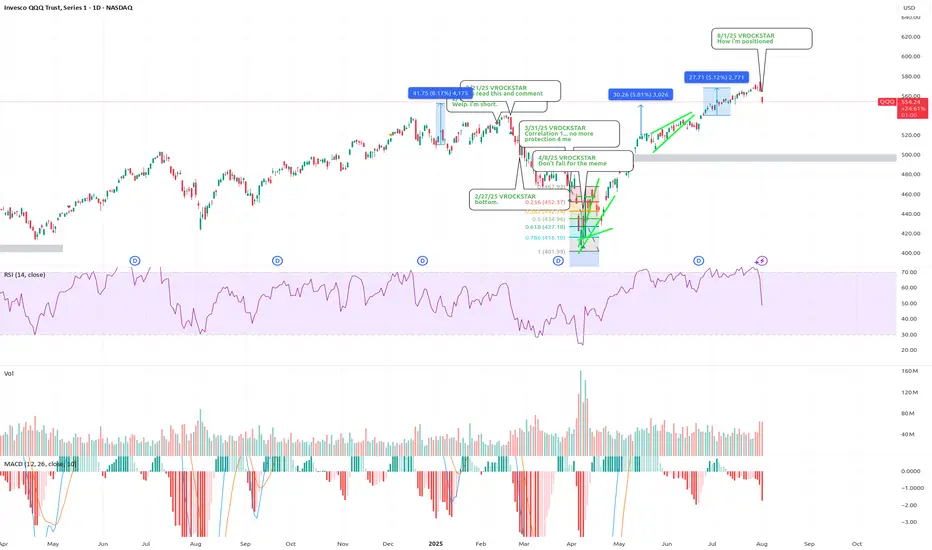
8/1/25 - $qqq - How i'm positioned 8/1/25 :: VROCKSTAR :: NASDAQ:QQQ
How i'm positioned
- 2x leverage on the whole book. 75% at risk so 150% gross
- so 25% powder
47% obtc
30% nxt (12.5% leaps)
36% deck (ST and leaps for 6.5%)
27% lulu (ST gas for 1% lol!)
8% mstr (ST gas for 80 bps lol!)
5% gme (ST gas for 40 bps!)
5% ses (covered with calls at 1 strike already)
be well. let's attack monday.
if we dip monday i think >50% chance that's the low
if we don't, i think >30% chance we go higher
so i'm bidding this selectively w balance of ST gas and high conviction plays.
V
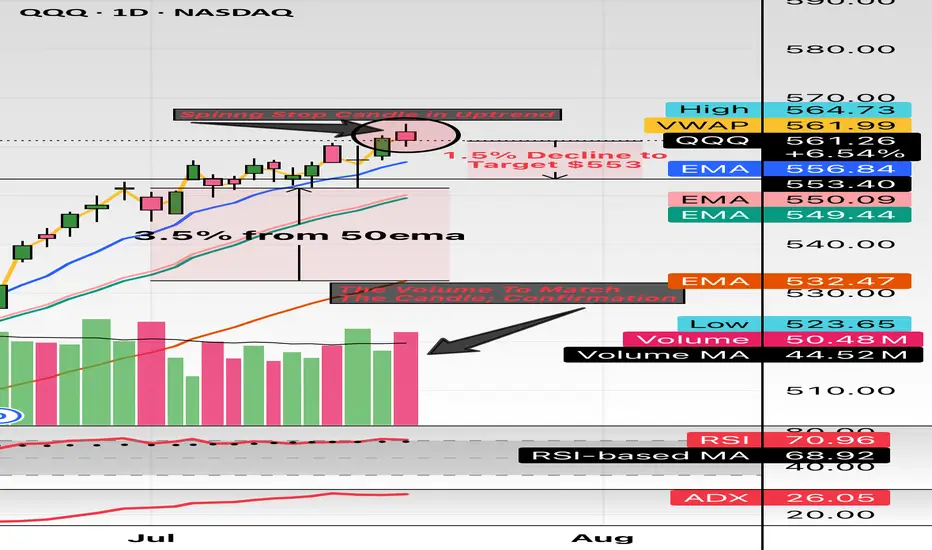
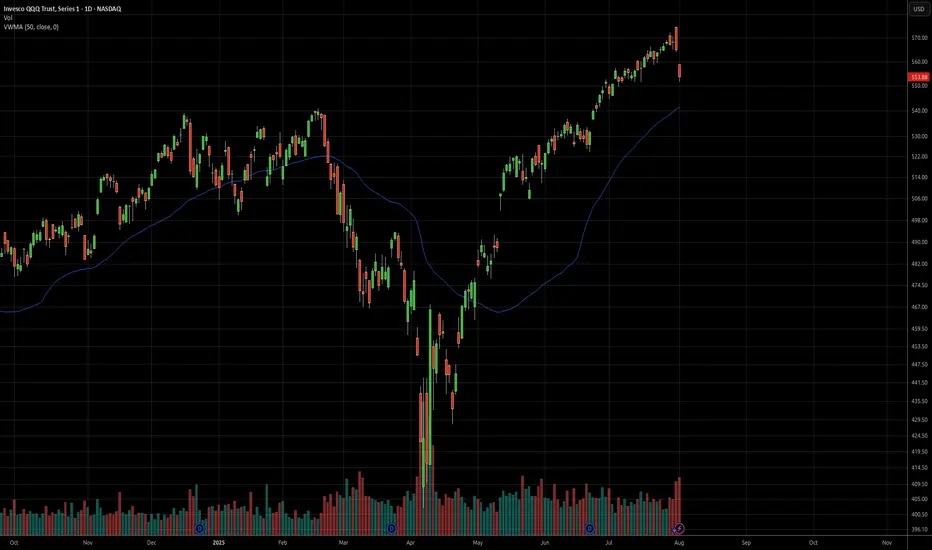
$QQQ this might the spot. Hello and good night, evening, afternoon, or morning wherever you may be. I have been looking at names all day and I wanted to check the indexes: NASDAQ:QQQ and $SPY.
Here we have the indexes up almost 30% from the April lows and sitting about 10% YTD. The candle highlighted is the spinning stop candle and has volume to match. These candles usually take place (green or red) in downtrends or uptrends and provide pivotal indication. The market has major earnings this week (07/21/2025 to 07/25/2025) with names like Google, Tesla, General Dynamics, Verizon, Domino’s And so forth.
This week could be a catalyst to see some great volatility. I believe staying 3% from moving averages so I have noted 3.5% from the 50EMA and revisiting the 20EMA and 21EMA in the low $550 area. My target is $553 which is only a 1.4% move which can happen in one session in this environment while staying 3.5% above the 50EMA.
My trade idea will be $553p for 07/25/2025. Good luck!
WSL
$QQQ August correction incoming?- August correction incoming? 🚨
- Greed is all time highs; People are complacent
- I believe a correction of 5-10% is healthy for the market to flush out excess and remove junk investments from the market.
- This involves people who are over-leveraged gets trapped.
- Personally, taking profits from risky bets, some profits from quality names and raising cash.
- Rotating money to defensive names.
- Not exiting the markets completely.
“Buy the rumor, sell the news”
---
### 🎯 **“Buy the Rumor, Sell the News” – A Trader’s Mind Game**
Imagine you’re not just following the market… you’re dancing ahead of it. This strategy flips traditional thinking on its head—and rewards those bold enough to act **before** the spotlight hits.
---
### 🕵️♂️ **Step One: Buy the Rumor**
- Traders catch whispers—like talk of a potential interest rate hike.
- The markets start to react *before* anything official is announced.
- Assets like gold might drop on the expectation alone… that’s your **entry point**.
You're not buying certainty. You're buying what the crowd *thinks* will happen.
---
### 🔊 **Step Two: Sell the News**
- Once the news breaks, it's already "old" to seasoned traders.
- That shocking headline? Already priced in.
- The market might reverse or surge unpredictably.
- This is when savvy traders exit, locking in profits from those who just arrived.
---
### 🧠 **Why It Works**
- Financial markets aren’t just driven by facts—they’re powered by **sentiment** and **anticipation**.
- By the time news goes public, smart money has already moved.
It’s like buying concert tickets before the band announces a tour—then selling them the moment fans go wild.
---
### 📉 **A Real Example**
- **Monday Rumor**: “The Fed will raise interest rates.”
- Gold begins to slide as traders prepare—this is your chance to act.
- **Thursday News**: The hike is confirmed.
- Instead of dropping further, gold might **rise** due to market overreaction or repositioning.
- You **sell** into that chaos—profit made.
---

QQQ in a hot moment!Based on my analysis, the #QQQ got the reversal pattern candle, and we will have some consolidation starting this week until the end of September 2025.
My analysis becomes invalid in the daily candle close above the $572.11 (the high of today)
Do your diligence and study more; technical analysis is just the probabilities overview.
QQQ: Price Action & Swing Analysis
The analysis of the QQQ chart clearly shows us that the pair is finally about to tank due to the rising pressure from the sellers.
Disclosure: I am part of Trade Nation's Influencer program and receive a monthly fee for using their TradingView charts in my analysis.
❤️ Please, support our work with like & comment! ❤️

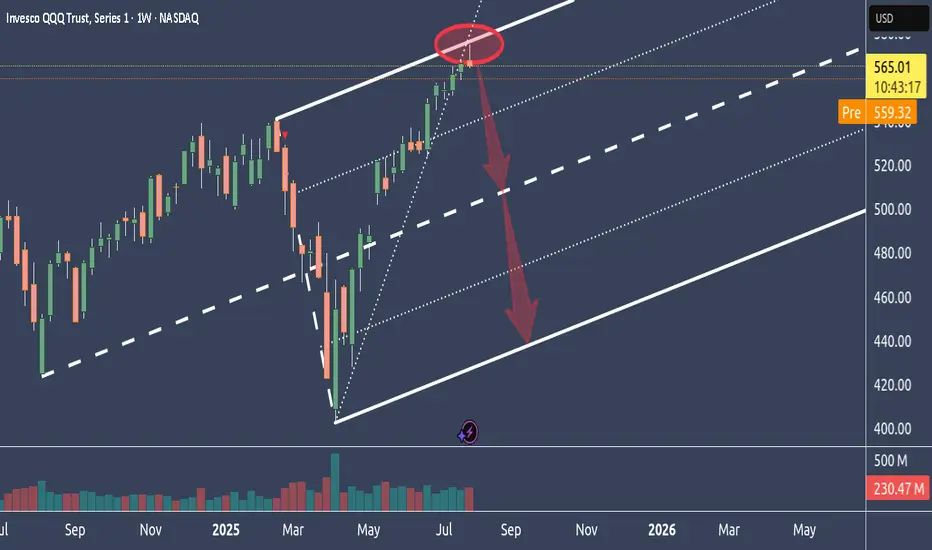
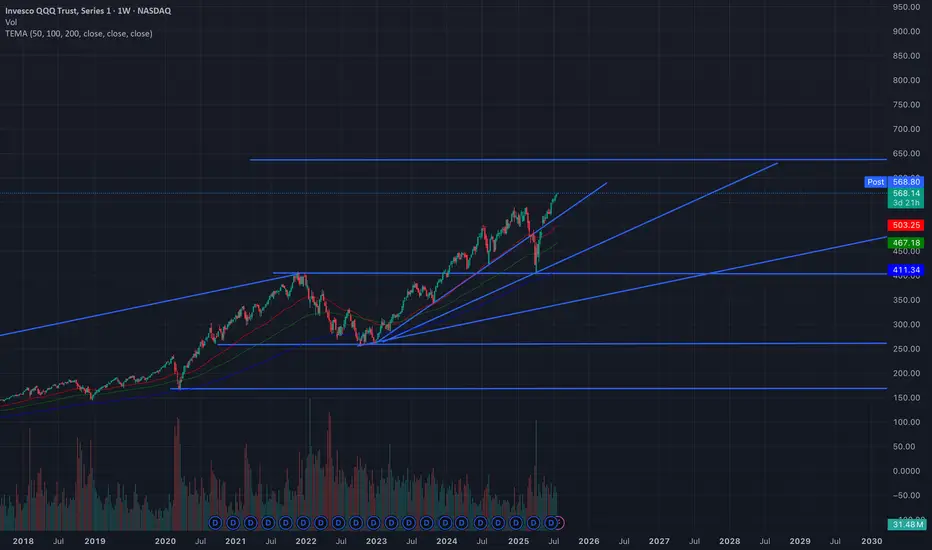
Why NQ is probably tanking big timeIn this weekly chart, we see QQQ, which represents the Nasdaq.
As we can see, it had a hell of a run up.
Too far too fast IMO, and it reached the stretch level at the Upper Medianline Parallel.
The natural move is now to let go, take a breath and trade down to center again, which is the Centerline.
After all the most major and most important earnings results are over, and Funds have pumped up their gains through manipulative Options plays, it's time to reap what they have planted and book the gains.
It's all in line with, all moves are at the point, and everything is showing in a simple chart.
Unless price is opening and closing outside of the U-MLH, it's time to load the Boat and sail to the South.
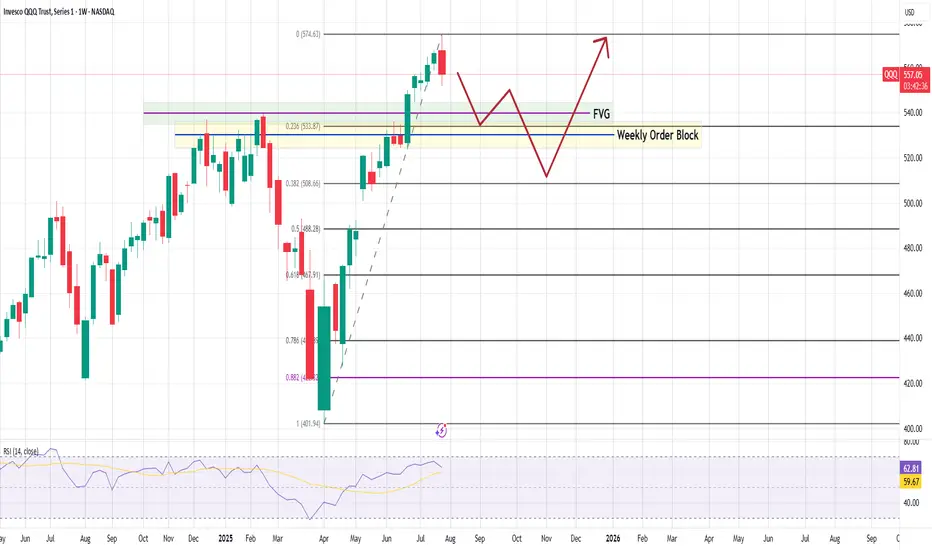
#QQQ Weekly Chart – Technical Breakdown As of August 1, 2025QQQ Weekly Chart – Technical Breakdown
🧠 Key Observations
Bearish Weekly Rejection
A red candle at the recent high ($574.63) suggests buyers are taking profits.
Short-term reversal likely in play.
First Reaction Zone:
0.236 Fib at $533.87 is the first potential bounce zone.
Aligned with:
Fair Value Gap (FVG)
Upper range of the Weekly Order Block (OB)
Deeper Demand Zone:
If $533 fails, the Weekly Order Block becomes critical.
That zone stretches down toward $520–$508 (Fib 0.382).
Strong historical reaction area — may attract long setups if macro aligns.
RSI Divergence Risk:
RSI shows some signs of flattening.
Still above 59, so momentum is intact — but weakening.
📉 Pullback Path (Base Scenario):
Potential move to $533 → $520, consolidating inside the order block
From there, bullish continuation back toward $575+
Invalidated below $500, where structure breaks
📈 Mid-Term Bullish Bias Intact
Strong uptrend, higher lows still in place
Any dip into the OB + FVG zone = buy-the-dip opportunity.
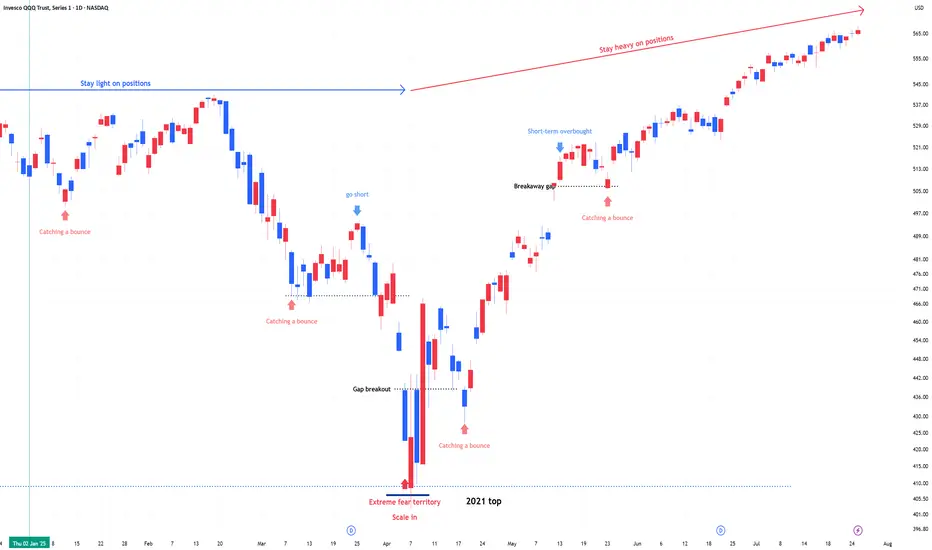
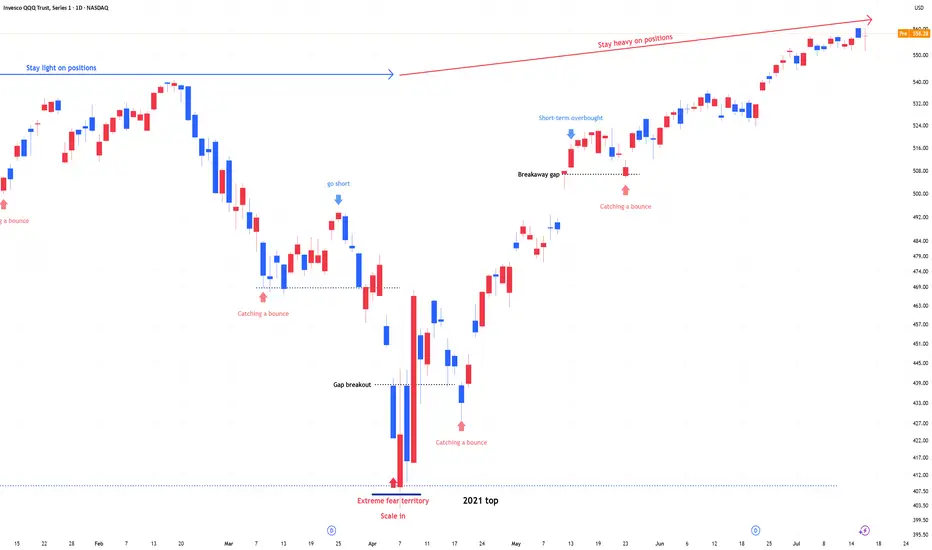
QQQ : Stay Heavy on Positions QQQ, QLD, TQQQ : Stay Heavy on Positions
Amid record-high markets, fear-hedging sentiment is slowly transitioning into renewed risk-taking.
When entering an underweight zone, I rotate out of QLD or TQQQ into QQQ and reduce overall exposure.
QQQ: Expecting Bullish Continuation! Here is Why:
Our strategy, polished by years of trial and error has helped us identify what seems to be a great trading opportunity and we are here to share it with you as the time is ripe for us to buy QQQ.
Disclosure: I am part of Trade Nation's Influencer program and receive a monthly fee for using their TradingView charts in my analysis.
❤️ Please, support our work with like & comment! ❤️
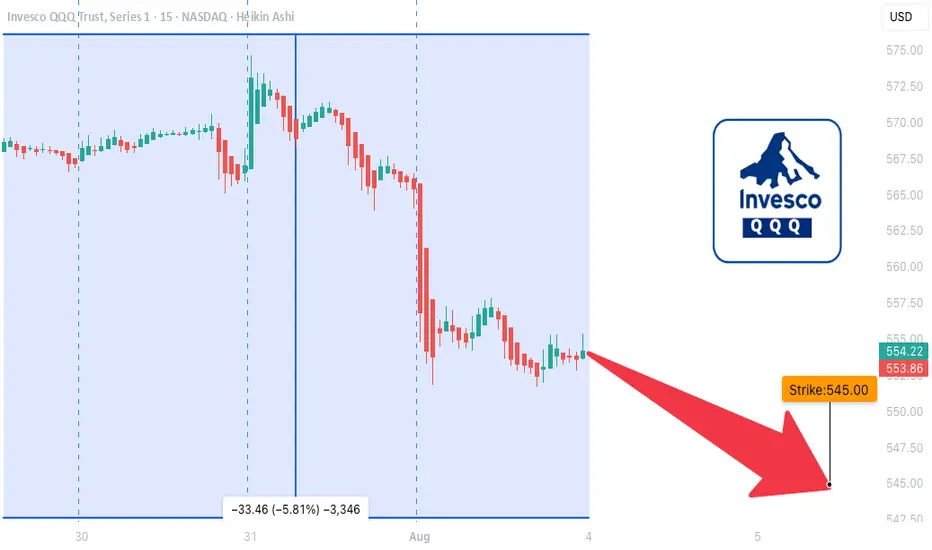
QQQ LEAP Trade Thesis – Aug 1, 2025
🧠 **QQQ LEAP Trade Thesis – Aug 1, 2025**
🎯 **Setup**: High-conviction LEAP PUT
📉 **Bias**: 🔻 *Moderate Bearish*
📆 Horizon: Long-Term (12+ months)
---
📊 **Multi-Model Intelligence Summary**
🧪 **Grok (xAI)**
• Monthly RSI = bearish 📉
• Trading near 52W highs = overvalued 💥
• Suggests: \$545 PUT
🧠 **Gemini (Google)**
• High conviction bearish
• Suggests: \$590 PUT (expensive premium)
🧬 **Claude (Anthropic)**
• RSI breakdown = confirmed weakness
• Recommends: \$530 PUT for max downside
🦾 **Meta (LLaMA)**
• Moving averages turning over
• Suggests: \$555 PUT – moderate confidence
🛰️ **DeepSeek**
• Long-term RSI confirms bearish drift
• Volatility ideal for LEAP entries
• Recommends: \$545 PUT
---
📍**MODEL CONSENSUS**
✅ Bearish trend across all models
✅ Favorable volatility (VIX ✅)
✅ Overvaluation = downside pressure
⚠️ Strike variance across models → we anchor at **\$545** for balance
---
💼 **TRADE SETUP (LEAP PUT)**
• 🔻 Direction: PUT (Short)
• 🎯 Strike: **\$545**
• 📆 Expiry: **2026-09-18** (413 days)
• 💰 Entry Price: **\$38.33**
• 🎯 Target: **\$76.66**
• 🛑 Stop: **\$24.91**
• ✅ Confidence: **75%**
• ⏰ Entry: Monday Open
• 📏 Size: 1 contract
---
📌 **Narrative**:
Every model says the same thing: RSI rollover, inflated price, and perfect LEAP conditions. Institutions are neutral → retail can front-run the decay. You don’t often get long-dated PUTs this clean.
🎯 Asymmetric risk/reward.
📉 Macro setup aligns.
🎯 Strong long-term positioning play.
---
🧠 Stay smart. Position early. Ride the macro shift.
🔔 Like + Follow for more AI-driven trade setups.
$QQQ Analysis, Key Levels & Targets574/576 Bear call spreads at open? Yes please. You know that those filled for 1.00 risk/1.00 reward - it was glorious.
Closed up 100%
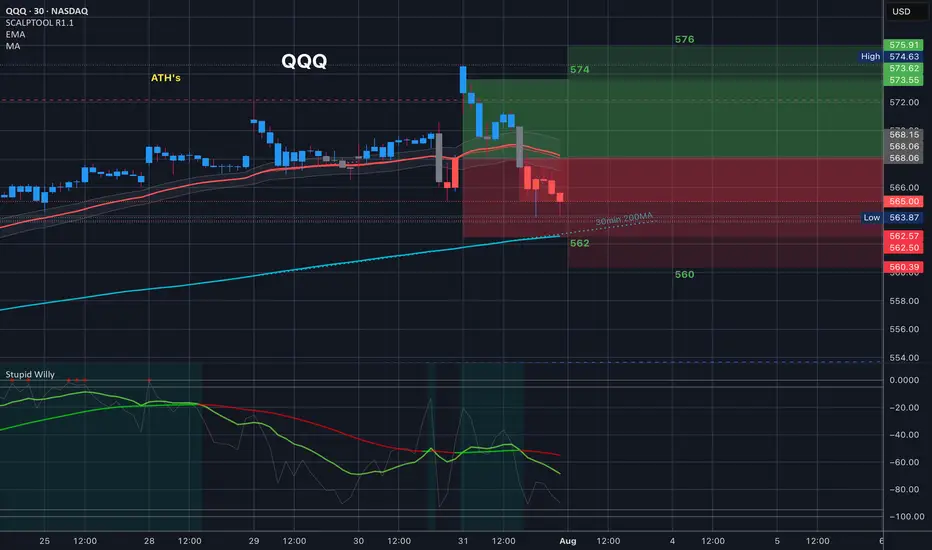
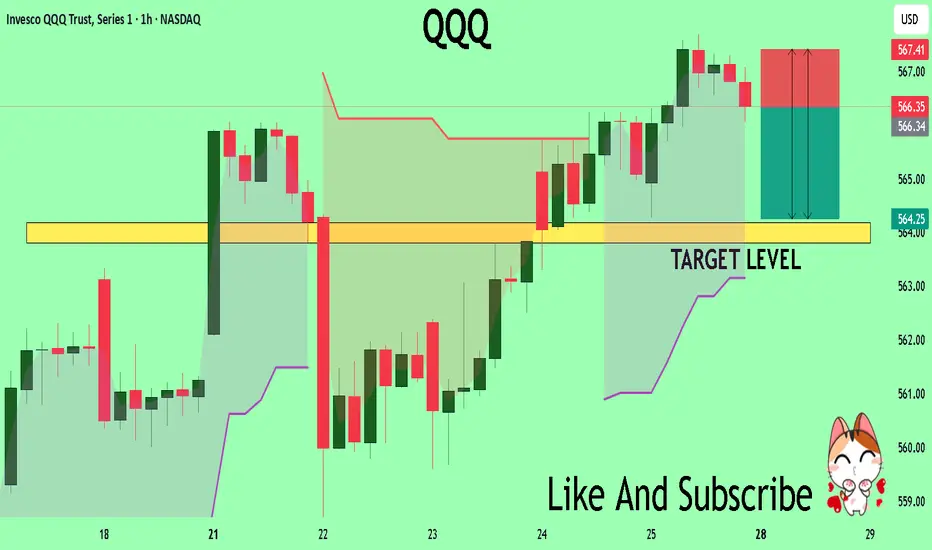
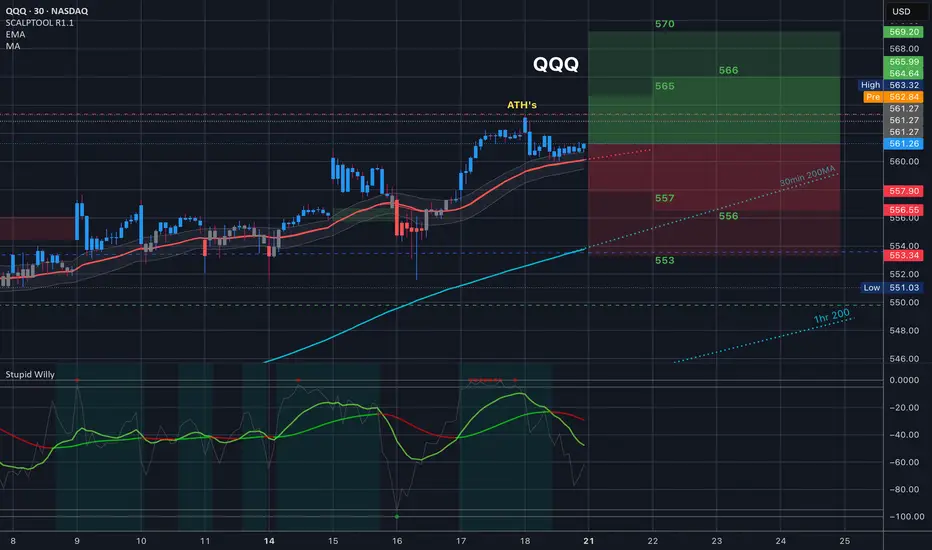
$QQQ Trading Range for 7.21.25 and everything in itToday’s Trading range and everything in it. How are you playing it?
QQQ healthy pullback so far - here are my targets for supportQQQ bears show up for the first time in months but zooming out show us the charts are still extremely healthy. Here are some of my targets for areas to find potential support

Stock Allocation IdeasIf you're building a stock portfolio, how you allocate your money matters as much as what you buy. Here’s a practical, risk-aware approach for retail traders and investors:
1. Core and Satellite Approach
Core (60–70%): Stick with strong, stable companies—large-cap names with reliable earnings like AAPL, MSFT, or JNJ. These form the foundation of your portfolio.
Satellite (30–40%): Use this portion for high-potential ideas—growth stocks, emerging tech (like AI or EV), or small caps. Higher risk, but higher potential return.
2. Mix Between Defensive and Growth Stocks
In volatile markets, lean toward defensive sectors (healthcare, consumer staples, utilities).
In bull markets or improving conditions, increase exposure to growth sectors (tech, consumer discretionary).
3. Blend Growth and Value
Balance high-growth stocks with undervalued, stable companies.
When interest rates are high or inflation is rising, value stocks often perform better.
When rates fall or the economy picks up, growth stocks usually lead.
4. Don't Ignore International Exposure
While U.S. stocks are strong, consider adding 20–30% exposure to global markets (Europe, Japan, or select emerging markets).
5. Stay Disciplined with Rebalancing
Check your portfolio every 3 months.
Take profits where gains have outpaced, and reinvest in areas that are still fundamentally strong but lagging.
Final Tip: Focus on position sizing and risk management. You don’t need to hit every trade—preserving capital and staying in the game is the priority.
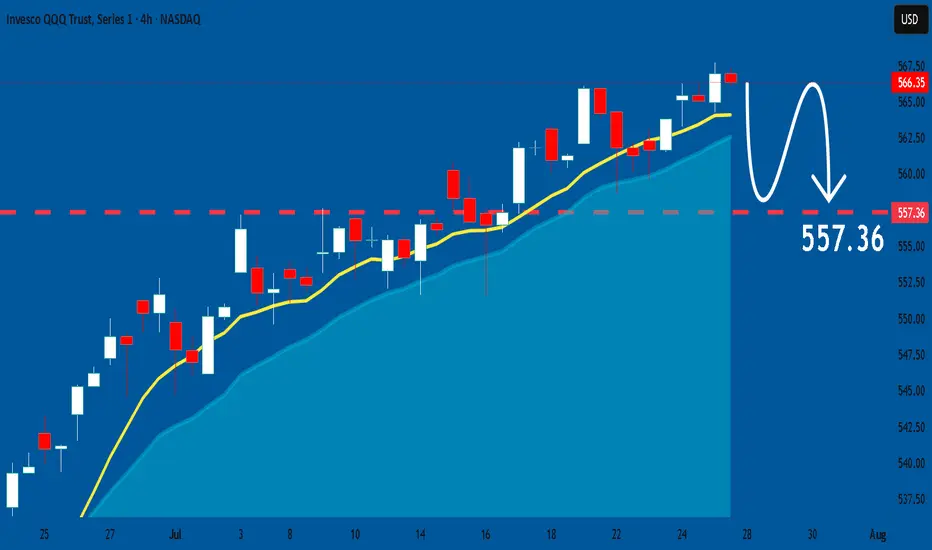
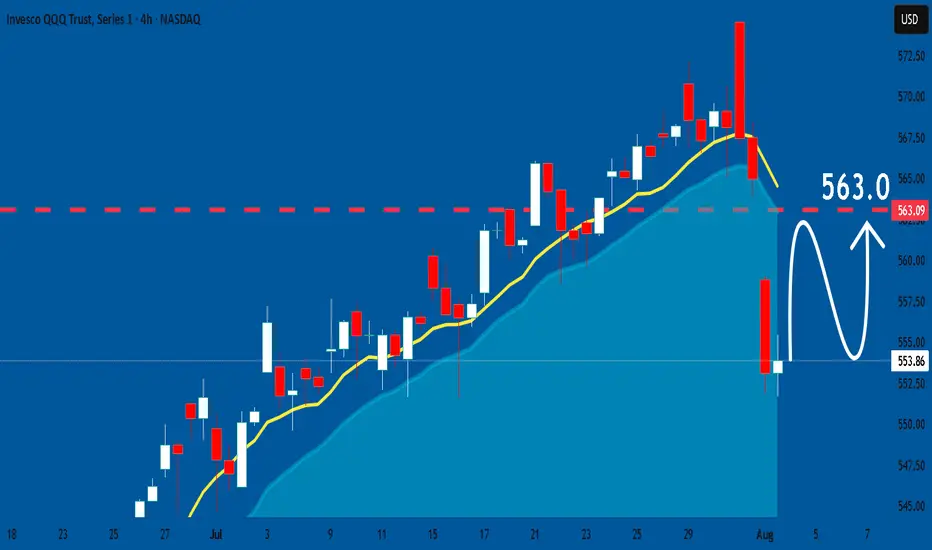
“QQQ Bounces Back — Trendline Still Holding”
📈 Trade Snapshot:
Despite a fakeout drop, QQQ holds the trendline. A break above $568.95 targets $570.64 short-term.
🎯 Setup Details:
→ Entry: $568.10
→ SL: ~$563.41
→ Target: $570.64
📌 Strong upward structure, with buyers defending key support.
📋 Hashtags:
#QQQ #BreakoutTrade #TrendlineSupport #ProfittoPath #ChartSetup #SwingTrade #PriceAction #SmartTrading

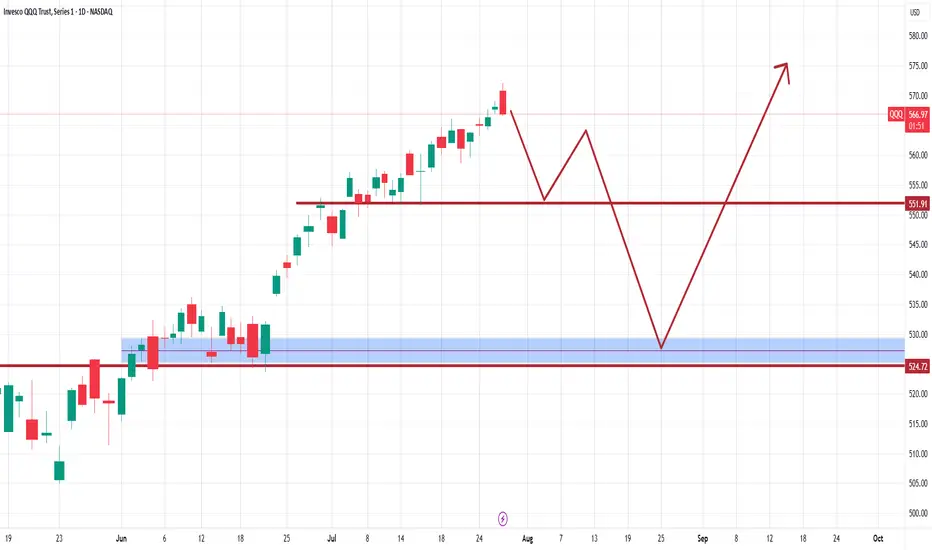
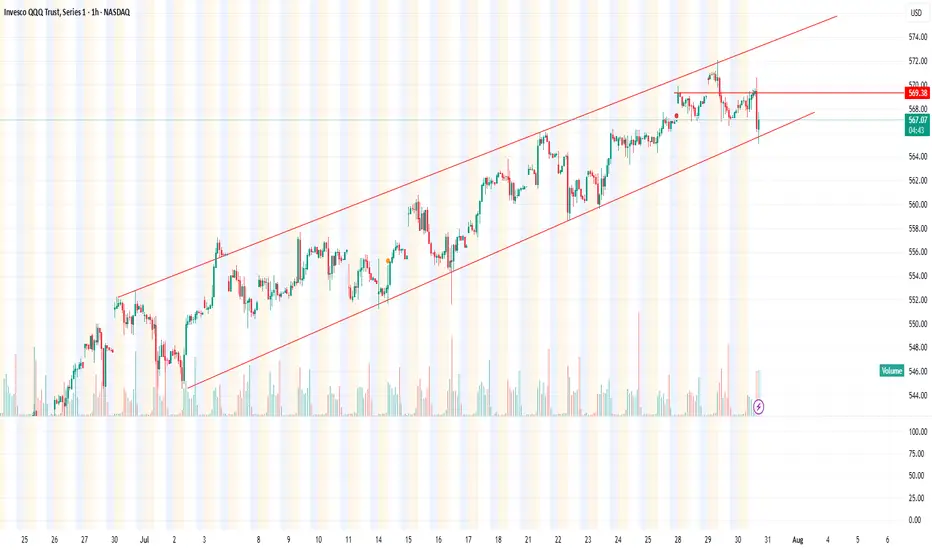
QQQ Forming Nice channelKey Observations:
Uptrend Channel:
QQQ has been trading within a rising channel.
The price respects both the support (lower red trendline) and resistance (upper red trendline) consistently.
Recent Price Action:
There was a sharp drop that briefly broke below the lower trendline support but quickly rebounded back inside the channel, indicating a false breakdown or buying strength at support.
A horizontal red line marks a previous resistance level, now potentially acting as a support.
Current Price:
The price is around $567.22, near the middle of the channel, but just below the recent local high/resistance.
Implication:
As long as the price stays within the channel, the uptrend remains intact.
A confirmed breakdown below the channel support would be bearish, while a breakout above the channel resistance would be bullish.
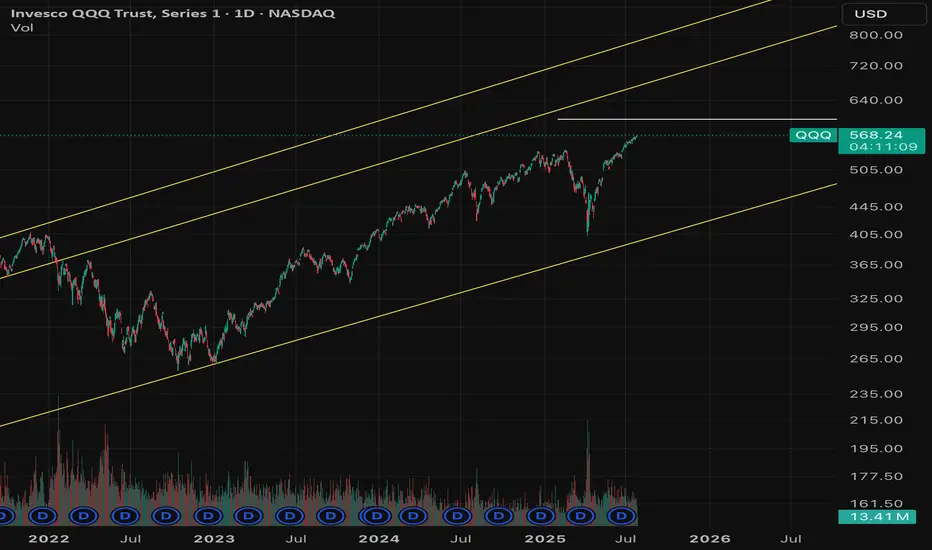
QQQ Technical Analysis: Bullish Trend Intact
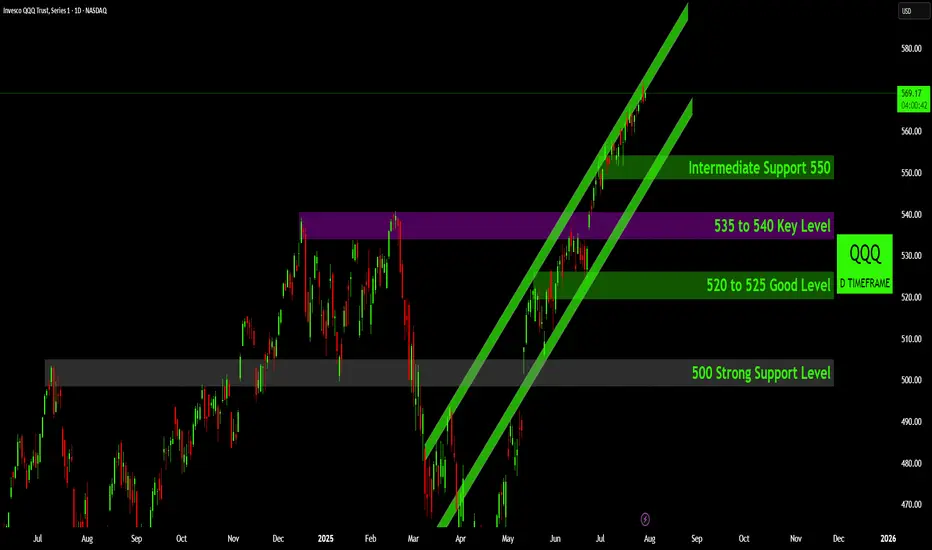
From a technical perspective, the QQQ is in a powerful and well-defined uptrend. The price action since the April low has been contained within a sharp ascending channel, confirming strong and consistent buying pressure. The market is currently testing the upper boundary of this channel, which often acts as short-term resistance and can precede a minor pullback or consolidation phase.
A major bullish development was the recent breakout above the 535-540 price zone. This area had served as significant resistance from December through February, and its conversion into a new support floor is a textbook sign of strength. This level will now be a critical pivot point for the market.
Should a pullback occur, the chart lays out a clear hierarchy of support levels. The first line of defense is the intermediate support at 550. Below that lies the crucial 535-540 pivot zone, followed by another support area between 520 and 525. The most significant long-term support rests at the 500 level, which was a major resistance ceiling for much of the prior year.
The overall outlook remains bullish. As long as the price respects the ascending channel structure, particularly the lower trendline, the path of least resistance remains to the upside. Traders will likely view pullbacks toward these established support levels as potential opportunities to join the prevailing trend. A break below the channel and the 535 level would be the first signal of a potential momentum shift.
Disclaimer:
The information provided in this chart is for educational and informational purposes only and should not be considered as investment advice. Trading and investing involve substantial risk and are not suitable for every investor. You should carefully consider your financial situation and consult with a financial advisor before making any investment decisions. The creator of this chart does not guarantee any specific outcome or profit and is not responsible for any losses incurred as a result of using this information. Past performance is not indicative of future results. Use this information at your own risk. This chart has been created for my own improvement in Trading and Investment Analysis. Please do your own analysis before any investments.
QQQ : Stay Heavy on Positions1) April Fear & Buy Signals
In early April, the Nasdaq 100 experienced a sharp sell-off, triggering extreme fear sentiment across the market.
At that point, scale-in buy signals appeared—classic "buy the fear" conditions.
2) Current Market State: No More Fear, but Watching
Since then, the market has stabilized.
The fear has disappeared, but we are still in a wait-and-see mode as traders assess the next move.
Momentum is holding, but participation remains cautious.
3) Stay Heavy on Positions
Despite short-term uncertainty, I’m maintaining an overweight position on the Nasdaq 100.
As long as we don’t see a major breakdown, the bias remains bullish.
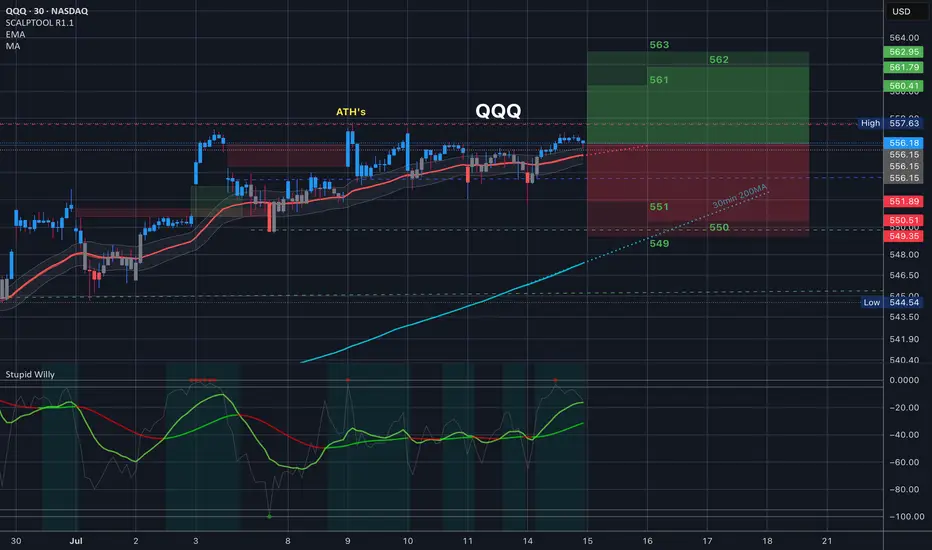
$QQQ Trading Range for 7.15.25 and everything in it for CPI
Tomorrow’s Trading range and everything in it. We have CPI in premarket tomorrow. This is the trading range. let's go.