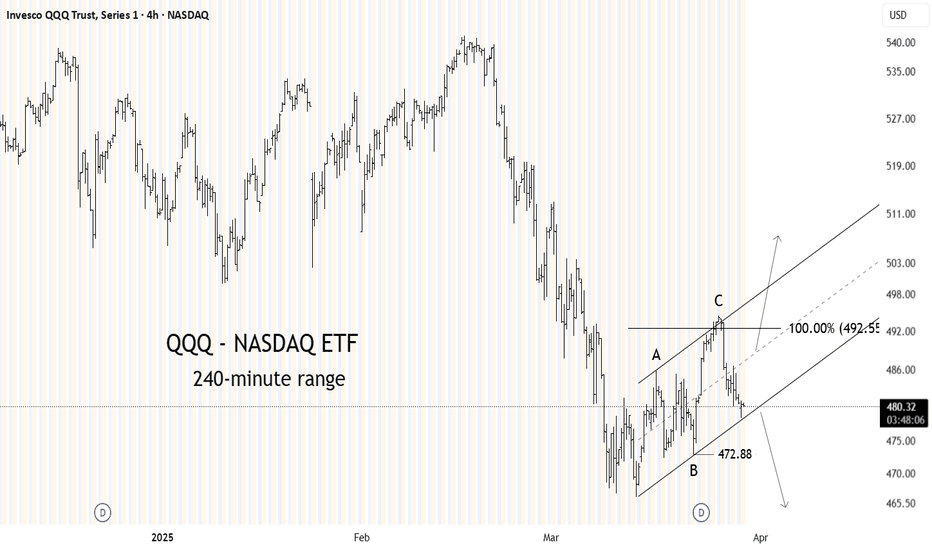
QQQ trade ideas
QQQ: Bullish Continuation & Long Trade
QQQ
- Classic bullish formation
- Our team expects growth
SUGGESTED TRADE:
Swing Trade
Buy QQQ
Entry Level - 468.97
Sl - 457.71
Tp - 491.73
Our Risk - 1%
Start protection of your profits from lower levels
Disclosure: I am part of Trade Nation's Influencer program and receive a monthly fee for using their TradingView charts in my analysis.
❤️ Please, support our work with like & comment! ❤️
QQQ Will Explode! BUY!
My dear subscribers,
This is my opinion on the QQQ next move:
The instrument tests an important psychological level 468.97
Bias - Bullish
Technical Indicators: Supper Trend gives a precise Bullish signal, while Pivot Point HL predicts price changes and potential reversals in the market.
Target - 488.44
My Stop Loss - 457.91
About Used Indicators:
On the subsequent day, trading above the pivot point is thought to indicate ongoing bullish sentiment, while trading below the pivot point indicates bearish sentiment.
Disclosure: I am part of Trade Nation's Influencer program and receive a monthly fee for using their TradingView charts in my analysis.
———————————
WISH YOU ALL LUCK
My market direction guide with extended-hour. Work best for >+1 day till expiration contract. (SWING)
Personal Interpretation of Indicator:
5MA=yellow(scalp trend)
20MA=orange(pullback of a larger timeframe’s 5MA trend)
I read how previous candles are behaving around 1hr 20MA and use pullback test rejection for direction signal. (Trade Planning, knowing the MA are align with larger timeframes like 4hr or day)
Then, I use 15min 20MA pullback test with wick rejection to find cheaper price entry.
Possible Similarities to 2022 Bear Market QQQ Weekly Chart. Very similar structure and price action to the run up and subsequent bear market of 2022. Plan is to sell into strength and possibly look for longs off deep support levels. If this scenario unfolds it will require adaptability and will present difficult trading scenarios that will punish hesitation and chasing. Great opportunities for long term investors off deep support levels such as 200 SMA on higher timeframes. A pull back to 450 would be the first target and the 21 EMA on the Monthly chart and the 89 EMA on the Weekly. Look for possible put options 7-21 DTE.
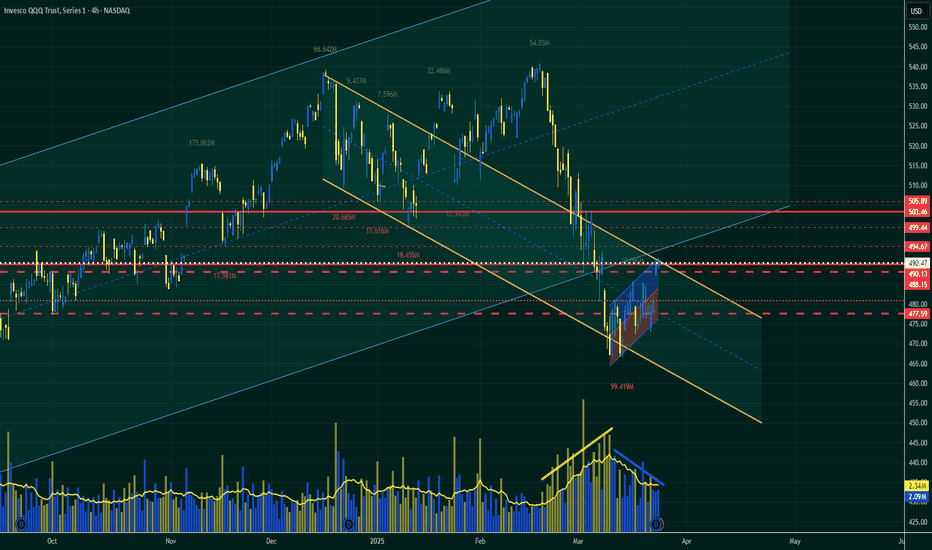
QQQ: Bearish Reversal Likely — Weak Buyer Conviction at Key ResiQQQ may be setting up for a bearish reversal, as several technical confluences suggest the recent rally is losing steam. Despite a short-term bounce, price is approaching a critical decision zone, and buyers appear to lack conviction.
🔺 1. Price Testing Upper Boundary of Descending Channel
QQQ has rallied into the upper boundary of the descending channel (yellow lines) that’s been in place since late December. This often acts as resistance—and the price has yet to break above it with strength.
🔵 2. Hitting the Edge of Rising Regression Channel
The current price is tagging the upper edge of the blue rising regression channel, an area that has previously triggered sell-offs. Unless there’s a decisive breakout, this could mark a local top.
📉 3. Volume Divergence – Weak Buyer Interest
Despite the recent rally attempt, volume is declining, showing clear divergence. This is a warning sign: while price moves up, momentum is fading, and buyers don’t appear to be stepping in strongly. It’s often a precursor to a reversal.
🟩 4. Lower Boundary of Rising Channel Still Intact... For Now
Price remains near the long-term rising channel’s lower support, but failure to hold this level could trigger accelerated downside.
📌 Key Levels to Watch:
🔻 Resistance
490.13 – 494.67:
This zone is packed with prior support-turned-resistance and coincides with the descending and regression channel boundaries. A rejection here would confirm the bearish thesis.
499.44:
A psychological and historical resistance level. Bears would likely pile in if price fails here again.
🔺 Support
488.15:
Immediate minor support. Weak defense here could quickly lead to further selling.
477.59:
Next key level below current price. If breached, it could validate a more extended correction.
🧠 Summary:
QQQ is at a technical crossroads, with several overlapping resistance levels and a clear lack of buying volume. Until buyers show conviction above 494–495, the setup favors a bearish reversal from current levels.
🔔 Watch for a rejection around 490–495 with increasing sell volume for confirmation.
💬 What’s your outlook? Do you see further downside or a breakout brewing?
Leaders Leading LowerIf you create a portfolio of equal parts AAPL, MSFT and NVDA, you'd have an index that represents 25% of the numerical influence on QQQ. Those three stocks account for most of the directional move of the Nasdaq 100. They are the bullies on the block and you aren't getting around them. Where they go the index will surely follow. So far this year that portfolio is off 12%, while QQQ is down around 7%. Think we've hit the bottom yet?
I'll be honest here friends it's not looking good...I'll be honest here friends it's not looking good...
This may have been a Dead Cat Bounce on the NASDAQ:QQQ and AMEX:SPY friends.
GAP fills in both names lead to Bear Flag Breakdowns which in my mind leads to the next leg down.
Rejecting 200DMA on the NASDAQ:QQQ and losing control on the AMEX:SPY
Markets are hanging on slightly, lets see what happens the rest of the week.
Not financial advice
QQQ Will Explode! BUY!
My dear friends,
Please, find my technical outlook for QQQ below:
The price is coiling around a solid key level - 481.04
Bias - Bullish
Technical Indicators: Pivot Points Highanticipates a potential price reversal.
Super trend shows a clear buy, giving a perfect indicators' convergence.
Goal - 498.55
Safe Stop Loss - 471.31
About Used Indicators:
The pivot point itself is simply the average of the high, low and closing prices from the previous trading day.
Disclosure: I am part of Trade Nation's Influencer program and receive a monthly fee for using their TradingView charts in my analysis.
———————————
WISH YOU ALL LUCK
QQQ: More Downside To Come?After the double top confirmed in mid-Feb, I expect that we see a retrace to previous pivot points around 495 - 509, where we will then see strong resistance. There is a confluence of selling points: the previous local top in July 2024, the support area found Dec - Feb 2025, and the weekly MAs turning over.
If we do find resistance in that area, I expect a continuation of the larger trendline break, with the high volume area between 435 - 450 being the most likely support. This would be a 15-20% correction from the top, which is fairly realistic. If we break down even further, then we would have a head & shoulders forming that would mean way more downside.
I will be playing the short side of this set up, since we have broken the trendline support (see my comment for where the trendline begins) and the MAs have now curled down.
Consider Going Long on QQQ with Key Levels in Focus -Key InsightThe current market sentiment for QQQ demonstrates cautious optimism with a potential bullish
breakout on the horizon. Traders should focus on key resistance levels as
indicators of momentum, with 485 being a critical marker. Holding above this
level could lead to a continuation of the upward trend towards 492. Watch for
consolidation phases if unable to maintain above 485. -Price Targets: For the
coming week, look towards a long position. Targets (T1) are set at 490 and (T2)
at 492. Protect your position with stop levels at (S1) 478 and (S2) 475,
ensuring a measured approach to potential downside risks. -Recent Performance:
QQQ has shown slight bullish tendencies with higher highs within its trading
range, supported by the broader market's cautious optimism. Trading has been
between strategic support and resistance levels, indicating potential to breach
critical thresholds. However, market consolidation and volatility remain
prevalent. -Expert Analysis: Experts advise monitoring resistance breaks for QQQ
as it aligns with movements in SPY and major stocks like Tesla. This alignment
is crucial for understanding broader market trends, allowing traders to
anticipate market directions. The anticipated temporary bullish phase could be a
pivotal moment for traders in capturing short-term gains. -News Impact: Recent
reports highlight Tesla's synchronization with broader market trends, suggesting
that QQQ will likely continue mirroring macroeconomic conditions. The sideways
movement observed in the past week points to investor indecision, requiring
strategic positioning to navigate potential volatility and capitalize on
temporary price movements.


