QQQ at a Critical Level! Key Trade Setups for This Week 🚀Market Structure & Price Action
* QQQ has bounced from a key reversal zone, signaling early bullish strength.
* The price recently broke a descending trendline, suggesting a potential short-term trend reversal.
* Resistance at $513.29 aligns with previous rejection levels, making it a key target.
* A break above $513 could open the path toward $530-$535 resistance.
Support & Resistance Levels
* Immediate Resistance: $491.81 (current rejection point)
* Major Resistance Zone: $510 - $513 (historical resistance)
* Support Levels: $486, $480 (highest negative GEX / put support)
* Breakout Target: $530, $535 (GEX Call Walls)
GEX & Options Flow Insights
* IV Rank: 49, suggesting moderate implied volatility.
* Options Flow:
* Calls: 12.13% at $510 (2nd Call Wall)
* Puts: -78.42% at $485 (2nd Put Wall)
* High Volatility Level (HVL): $513, indicating a crucial pivot level.
Indicators Overview
* MACD: Showing signs of bullish momentum with a potential crossover.
* Stoch RSI: Oversold and turning up, suggesting a rebound is in play.
Trade Scenarios
Bullish Setup (Breakout Play)
* Entry: Above $492
* Target 1: $510
* Target 2: $530
* Stop Loss: Below $486
* Confirmation: High volume breakout above $491.81
Bearish Setup (Rejection Play)
* Entry: Below $486
* Target 1: $480
* Target 2: $475
* Stop Loss: Above $492
Conclusion
QQQ is approaching a key decision zone. If buyers can push above $491.81, we could see a strong rally toward $510+. However, failure to break above this level could result in another rejection back to $480-$475.
📌 This analysis is for educational purposes only and does not constitute financial advice. Always do your own research before making trading decisions.
QQQ trade ideas

QQQ relief bounce on the cardsNASDAQ:QQQ is at a critical level which will lend itself to a relief bounce in the coming weeks.
Note: This is not a trade recommendation do your own due diligence.

Market Update - 3/9/2025We're quite oversold on all indexes, so at this point probably everyone is expecting some bounce next week. How strong it will be is uncertain, but the likelihood of it happening is quite high.
I've been ruthlessly cutting losses on all my trades to 1/3 of my historical average losses, and due to a nice big trade on NASDAQ:JVA , I actually made $33 this week, which I'm really happy about given the tough market environment we are in. Just goes to show how much you can improve your RR by cutting losses even shorter than normally.
I still see a lot of strength in car-related names, as well as in communications / electric component names. Didn't mention but industrials ( AMEX:XLI ) was the leading industry on Friday, so that's also kind of confirming. Some really nice setups for next week in NASDAQ:VEON , NASDAQ:REBN , NASDAQ:PONY , NYSE:FPH , NASDAQ:PRCH

Interesting comparison of stocks above the 20 day averageIf we take a look at historical times when this percentage of stocks above the 20 day average have hit below 20% we often will see a new high or at least a nice big move to the upside on the overall market. NASDAQ:QQQ

NASDAQ: Buy the Dip; Hold the Grip
Tech:
Dip to horizontal support + 50% fib + TL
Normal drop and expect a rally or sideways market

Stock Market Forecast | TSLA NVDA AAPL AMZN META MSFTStock Market Forecast | NASDAQ:QQQ AMEX:SPY
Mag 7 Forecast | NASDAQ:TSLA NASDAQ:NVDA AAPL AMZN META MSFT GOOGL

QQQ / NDX: Also a potential dead cat bounce like SPX?I examine the Qs and provide some key levels to watch.

QQQ Trading Opportunity! BUY!
My dear friends,
QQQ looks like it will make a good move, and here are the details:
The market is trading on 491.81 pivot level.
Bias - Bullish
Technical Indicators: Supper Trend generates a clear long signal while Pivot Point HL is currently determining the overall Bullish trend of the market.
Goal - 509.46
About Used Indicators:
Pivot points are a great way to identify areas of support and resistance, but they work best when combined with other kinds of technical analysis
———————————
WISH YOU ALL LUCK

QQQ , Tradeable bull bounce is likely next week for us .I think we will have a period of strength next and probably see longs start to work .
Today the market found strong buying at the November lows after undercutting briefly .
Ask yourself , if you were bearish would you short here after three weekly bear closes , does the risk reward work here . The answer is no . The situation at least temporarily favors the longs .
The bulls see "opportunity" , things are oversold and they see this as a low risk area to buy their " cheapies " .
The bears on the other hand see this as a good area to take profits and they will probably try to short higher when they see potential weakness resuming and try their best to get a lower high .
I don't know what will happen but I do think those arguments are logical and expecting a tradable bounce next week for longs is a high probability .
* Suggest to be nimble and make sure to take some profits on those longs as it is given, don't expect excess of what the market is making clear for now . Bears will try again probably higher up to make their lower high , so securing at least some profits on near term longs quickly is important .

Rising Channel - QQQ's Here is a good reason why we saw a bounce on the charts today after a really bearish week on the QQQ's.

QQQ Inverse Head and ShouldersLooks like high volume and close still within the downward channel in pink. This week made a new low but then rebounded end of day. Next week we can see 495 to 510 .
BTC is making the same pattern which I am bullish on too/

$QQQ Trading Levels for March 7 2025
200DMA and Weekly 35EMA above us. That’s not a good sign. Especially that we didn’t get much of a bounce there.
Today’s Implied move is +/-2.03% and Mondays is +/-2.67%
Let’s go Traders!!!

QQQ Stock Chart Fibonacci Analysis 030625Trading Idea
1) Find a FIBO slingshot
2) Check FIBO 61.80% level
3) Entry Point > 493/61.80%
Chart time frame: B
A) 15 min(1W-3M)
B) 1 hr(3M-6M)
C) 4 hr(6M-1year)
D) 1 day(1-3years)
Stock progress: B
A) Keep rising over 61.80% resistance
B) 61.80% resistance
C) 61.80% support
D) Hit the bottom
E) Hit the top
Stocks rise as they rise from support and fall from resistance. Our goal is to find a low support point and enter. It can be referred to as buying at the pullback point. The pullback point can be found with a Fibonacci extension of 61.80%. This is a step to find entry level. 1) Find a triangle (Fibonacci Speed Fan Line) that connects the high (resistance) and low (support) points of the stock in progress, where it is continuously expressed as a Slingshot, 2) and create a Fibonacci extension level for the first rising wave from the start point of slingshot pattern.
When the current price goes over 61.80% level , that can be a good entry point, especially if the SMA 100 and 200 curves are gathered together at 61.80%, it is a very good entry point.
As a great help, tradingview provides these Fibonacci speed fan lines and extension levels with ease. So if you use the Fibonacci fan line, the extension level, and the SMA 100/200 curve well, you can find an entry point for the stock market. At least you have to enter at this low point to avoid trading failure, and if you are skilled at entering this low point, with fibonacci6180 technique, your reading skill to chart will be greatly improved.
If you want to do day trading, please set the time frame to 5 minutes or 15 minutes, and you will see many of the low point of rising stocks.
If want to prefer long term range trading, you can set the time frame to 1 hr or 1 day.

$QQQ - we are closeSince the beginning of 2023, NASDAQ:QQQ has bounced every time it retests the uptrend line. Look at how the 200DMA tracks along that trendline.
The RSI is at a level where it has bounced previously. We are close to a relief rally. 👀

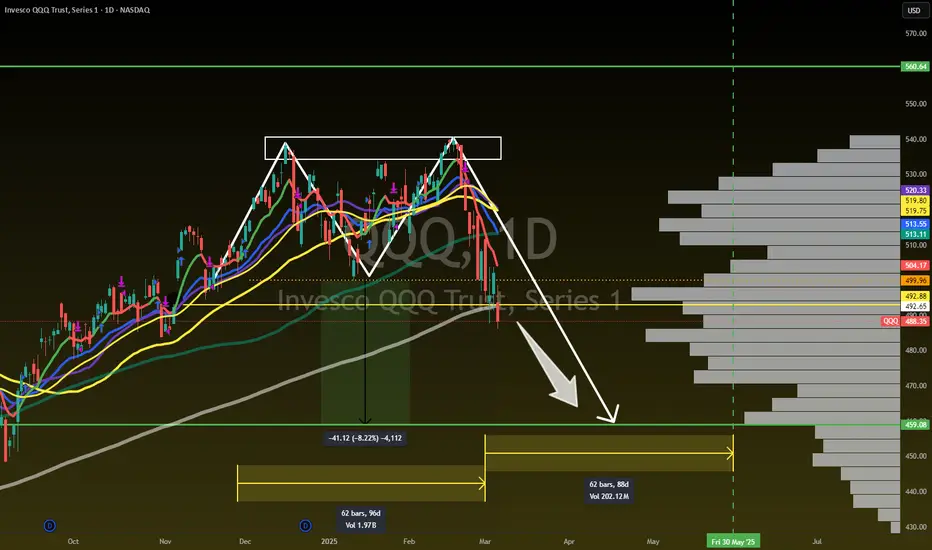
The Double Top is in on QQQNASDAQ:QQQ - DOUBLE TOP 🗻🗻
No Denying it NOW!
Measured Move is $459 by 30May
Not financial advice
QQQ - support & resistant areas for today March 6, 2025Above are the key support and resistance levels for QQQ today.
These levels can indicate where the price might reverse or consolidate and may signal potential long (buy) or short (sell) positions for traders.
These levels are calculated using mathematical models and are relevant for today’s trading session. Please note that they may change in the future.
If you find this information helpful and would like to receive these insights every morning at 9:30 AM, please support me by boosting this post and following me @OnePunchMan91.
Your engagement is greatly appreciated! If this post does not receive more than 10 boosts, I may reconsider providing these daily updates. Thank you!
Some Old charts we posted:

$QQQ Analysis, Key Levels & Targets for March 6th 2025
WEEKLY 35EMA. Put that level on the weekly chart and you’ll know exactly where the battle ground is today. You can see it running through the last few trading sessions.
I have 487 as support - and if this breaks the next support is at 448.

$QQQ Analysis, Key Levels & Targets for March 5th 2025 NASDAQ:QQQ Analysis, Key Levels & Targets for March 5th 2025
What is running through the trading range today?
The Weekly 35EMA and the 30min 35EMA. Critical level here.
Expected move 486 to 505 (+/- 1.70%)
Where is support under our trading range? 448 :O

reached support - bouncing on volumeThe weekly reached oversold status and that is usually a very good probability of a bounce, not clear at this point if the bounce will be substantial. My guess is towards the bottom of the upsloping trendline. 2025 will most likely be see-saw action. I doubt we'll see new highs in the next month or two.

$QQQ $508 Rug Pull ? All in on REDSo… attaching the bar pattern from Spring 2022, I see the next decline by the middle of next week. I’ll be placing my bets at today’s close if possible . 🫡 Target is $480 by next Friday. Short $508 into next week.

QQQ, Don't miss your moment , Believe in your systems, Be readyHey just a note, we finally saw the market show some life , no H1 but nearly . And maybe tomorrow we will continue up . For last several days breakouts were almost all failing and that just changed today , back to showing life , just when our human side is getting tired and many of us are losing interest .
Do not miss this , now may be it , the market is a master at getting more active traders to miss their moment with stuff like this , we do all the hard work when the getting tough but lose sight seemingly at the last moment , could be PnL and down draw related and also having your strategy fail repeatedly sucks life force . Whatever it is , this game is mental . And the more stocks you trade and transactions you make , the harder it is to sustain consistent mental game when the getting's tough .
One of the things that made me profitable in 2022 was doing only one strategy at first that only trades one name and I can do that with my eyes closed now , its pretty hands off and mechanical . But, the breakout buys on 5m for potential big winners is much harder and transaction heavy and full of losses you usually are running in a down draw between the big wins that make it work and it's too easy to miss them then you lose your edge . Do not miss your moments they are probably near .....
My key focus names for tomorrow , are down to :
ATAT, BROS, ORLA, AHR, SOBO , QFIN .
These there's many more but I am giving these preference for now , they are at the best breakout areas . Lots of other stuff looks great but is much higher . So that's the logic there , trying to catch fresh themes.
Besides the 5M Breakout buys,
I also run a monthly strategy that trades up to 3 names at end of every month . It currently holds VRNA, URBN, ATAT , and AHR. I highly suggest doing something like this with more money than your intraday entries ( vs account size ) .Slower timeframes are much easier to make money and keep your hairline :) The goal with that one is to only manage it every months end.
Other than that I cant touch it .....
Its a good way to buy GLB or key breakouts that you can maybe hold many months..... easy to get 50% moves or more on stuff that works and you don't have the hassle of buying quicker breakouts or pullbacks ect ect ...The downside is that you are trading smaller because your stop is far... I use monthly but weekly is another consideration .

QQQ: Capacity of the PullbackThis chart presents a Fibonacci channel projection based on key swing points, including a Higher High, Higher Low, an All-Time High (ATH), and a current Lower Low.
The levels of Fibonacci channel that market should abide by for the nearest future, are defined by: HL & LL - sets direction (fib 0 line); applied to ATH (fib 1 line). The derived fib ratios help to anticipate future price movements acting as key resistance where the pullback (reaction to prior impulsive bearish wave) might reach in respect to its structural capacity. B&W dashed line indicates a potential inflection point where the price could either reverse or extend further into supply zones.

How I play 0DTE during EOD volatility of last 15min/30minChart is from yesterday 3/3/2024(mon) + today 3/4/2024(tue)
Timeframe:1min
Indicator used: MACD, SlowStochastic RSI, 5MA, 20MA.
I use 1min 5ma as TREND(S) to scalp, just make sure MACD+SlowStochastic agrees.
