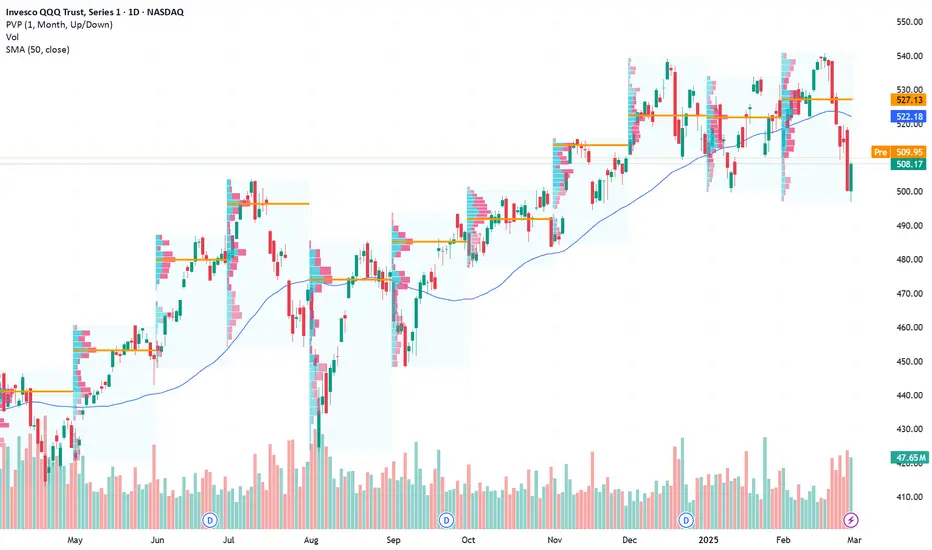
$QQQ Analysis, Key Levels & Targets for March 4rd
We have to levels in tomorrow’s Trading range to be aware of -
1. The 1W 35EMA just above where we closed
2. And the 35EMA on the 30min timeframe.
That’s it in the trading range but of course you can see a lot around it and I went over it all in tonight’s video.
Gonna be a wild one - let’s go!!!
QQQ trade ideas

QQQ at a Pivotal Zone! Bounce or More Downside?📊 Technical Analysis (TA):
1. Trend & Structure:
* QQQ is in a clear downtrend, confirmed by multiple Break of Structure (BOS) signals.
* A recent Change of Character (ChoCH) attempt suggests a potential short-term reversal, but confirmation is needed.
* Key Resistance: ~520-530 (supply zone)
* Support Zone: ~490-495 (current demand area)
2. Indicators Suggesting a Possible Reversal:
* MACD: Beginning to flatten, indicating potential momentum shift.
* Stochastic RSI: Deeply oversold, increasing the probability of a short-term relief rally.
* Volume Spike: Heavy volume at support, suggesting potential accumulation.
🔹 GEX & Options Flow:
1. Call Walls (Resistance) 🚧
* 530-535: Strong resistance, likely to reject price if tested.
* 540: 2nd Call Wall, major gamma resistance.
2. Put Walls (Support) 🛑
* 490: Highest negative NETGEX, meaning a breakdown could trigger heavy selling pressure.
* 475-460: Next major support levels if 490 fails.
3. IV Rank & Skew:
* IVR 46.1, indicating mid-range implied volatility.
* Puts dominate at 61.4%, signaling bearish sentiment.
* Implied move ±0.39%, suggesting a volatile session ahead.
📌 Trading Plan & Suggestions:
* Bullish Reversal Scenario:
* If QQQ holds 490-495, we could see a bounce toward 510-520.
* Ideal trade: April 500C or 510C, targeting a relief rally.
* Bearish Breakdown Scenario:
* If QQQ loses 490, downside targets extend to 475-460.
* Ideal Put Play: Buy March-April 490P or 480P, targeting 470-460.
⚠️ Key Warning: If QQQ does not reclaim 500 quickly, expect continued selling pressure.
🔥 Conclusion: QQQ at a Decision Point – Relief Rally or Breakdown?
The Nasdaq ETF is testing a key support level, with early reversal signals forming but heavy put positioning remaining. The next sessions will determine whether buyers defend this zone or we see a deeper correction. Watch 490-495 closely for price action confirmation! 🚀📉
🚨 Disclaimer:
This analysis is for educational purposes only and does not constitute financial advice. Always do your own research and trade responsibly.

QQQ Chart Fibonacci Analysis 030325Trading Idea
1) Find a FIBO slingshot
2) Check FIBO 61.80% level
3) Entry Point > 498/61.80%
Chart time frame: B
A) 15 min(1W-3M)
B) 1 hr(3M-6M)
C) 4 hr(6M-1year)
D) 1 day(1-3years)
Stock progress: C
A) Keep rising over 61.80% resistance
B) 61.80% resistance
C) 61.80% support
D) Hit the bottom
E) Hit the top
Stocks rise as they rise from support and fall from resistance. Our goal is to find a low support point and enter. It can be referred to as buying at the pullback point. The pullback point can be found with a Fibonacci extension of 61.80%. This is a step to find entry level. 1) Find a triangle (Fibonacci Speed Fan Line) that connects the high (resistance) and low (support) points of the stock in progress, where it is continuously expressed as a Slingshot, 2) and create a Fibonacci extension level for the first rising wave from the start point of slingshot pattern.
When the current price goes over 61.80% level , that can be a good entry point, especially if the SMA 100 and 200 curves are gathered together at 61.80%, it is a very good entry point.
As a great help, tradingview provides these Fibonacci speed fan lines and extension levels with ease. So if you use the Fibonacci fan line, the extension level, and the SMA 100/200 curve well, you can find an entry point for the stock market. At least you have to enter at this low point to avoid trading failure, and if you are skilled at entering this low point, with fibonacci6180 technique, your reading skill to chart will be greatly improved.
If you want to do day trading, please set the time frame to 5 minutes or 15 minutes, and you will see many of the low point of rising stocks.
If want to prefer long term range trading, you can set the time frame to 1 hr or 1 day.

NOTHING NEW HEREJust a pullback taking place in the markets, until this level is broken the uptrend is still in tact and I see this as just another chance to get in. Valuations were too high before this decline however now we're seeing tech stocks trading at attractive multiples.

Long QQQ on Breakout Above Key Resistance Levels Next Week
- Key Insights: QQQ has shown signs of recovery but remains susceptible to
volatility driven by tech stock performance. Monitoring price movements
closely, especially around resistance levels, will be crucial. A breakout
above $518 could signal a more sustained upward momentum, while a
consolidation below might indicate prolonged caution.
- Price Targets: Next week targets: T1: $518, T2: $524. Stop levels: S1: $500,
S2: $495.
- Recent Performance: QQQ experienced a rebound of over 1.5% recently,
reflecting a reaction to previous selling pressure. However, the index,
along with the Nasdaq, is still positioned below significant resistance
levels, suggesting that further upward movement may face challenges.
- Expert Analysis: Market experts emphasize the importance of key technical
indicators and the need for QQQ to break resistance at $518 to signal
potential recovery. With the Fear and Greed Index indicating "extreme fear,"
investor sentiment remains cautious, underscoring the need for careful
observation of market trends and movements.
- News Impact: Rising mortgage rates and economic concerns, particularly around
inflation and potential Federal Reserve interest rate changes, have
contributed to market volatility. These macroeconomic factors are critical,
as they influence consumer spending and can impact technology sector
valuations, which are key drivers for QQQ.
$QQQ Analysis, Key Levels & Targets for March 3rdAlright, y’all… I am still sick and still dealing with the fatigue so I’m not going to write a whole lot but here are the levels for tomorrow.
You know what to do with them… lol
And we will go over it all tonight.
Don’t forget to hit the “Grab this Chart” button under this chart is you want to use it.

The index is preparing for a free fall. NASDAQ:QQQ AMEX:SPY NASDAQ:NVDA NASDAQ:TSLA
This is the QQQ chart. On the monthly, a head and should pattern is forming. Look at the left and right side of the purple box. The index is preparing for a free fall. QQQ's support is at 485. NVDA and TSLA will sync with the index. Plan ahead.

QQQ On The Rise! BUY!
My dear subscribers,
QQQ looks like it will make a good move, and here are the details:
The market is trading on 508.17 pivot level.
Bias - Bullish
Technical Indicators: Both Super Trend & Pivot HL indicate a highly probable Bullish continuation.
Target - 520.29
About Used Indicators:
The average true range (ATR) plays an important role in 'Supertrend' as the indicator uses ATR to calculate its value. The ATR indicator signals the degree of price volatility.
———————————
WISH YOU ALL LUCK

QQQ - The Warning-Line Scenario For A ShortIt's simple a s that:
If price can't make it back into the Fork, then it's doomed to reach at least the Warning-Line.
This scenario likely happens if the current weeks bar close below the Warning line, and the open of the new Bar is also outside of the Fork.
Happy Short §8-)

QQQ , is currently very bullish .... but short list included .Quick summary of little write up below :
1) Probably should not start to get bearish unless bears can get price below November 2024 low , ideally a monthly close below
2) A full cash signal is a close below monthly 21 ema , at that point it's "possibly" a bear market and we should be in cash .
3) After we get get a cash signal , then we need to wait to have a high 2 close to redeploy capital for long risk on stuff ....and should probably long the market right at the following H2 close (when it happens)
4) I practice that myself and it is based on 127 year study of the same occurrences vs monthly.
==================================================================================
Longer version and short ideas I have on my list .
I have been hearing a lot of people are in cash right now and I like to look at the monthly chart , in fact I have tested the down jones back to 1897 on personal studies vs it's monthly and I think its a great way to gauge the market and even take slower less emotional trades .
I have marked up the chart here and shown where we should be in cash for 2022 bear market as an example . I really don't think now is the time to be in cash like many are saying I think that we obviously need to manage risk and listen to market.
BUT, with the exception of the bearish wick from three months ago and the fact that we do have a Low 2 monthly candle which is a weak af sell signal, the bears have not even been able to get us below the nov 2024 lows and that is my line in the sand to begin to potentially take some monthly shorts .... but for now those same shorts are probably longs .
Some key points for me are a close below the monthly 21 ema ( lower one ) its a cash signal .
That's a "monthly close" not the price momentarily going there .
Then once that happens you can just wait for two higher than prior bars closes , which I call high 2's or H2 for short . This is a very simple way to keep you out when getting is not good or switch to shorts and the odd names that are still at highs and ignoring a bear ( hard to do but there's always a few ) .
Ok so finally , should bears start to get price below NOV low here's a list of stuff that might work well . But want to add that right now we should be doing the opposite and focusing on reversal trades and strength .
SHORT IDEA LIST (QQQ must at very least be under nov low to consider acting for me )
PLTR
DUOL
HIMS
APP
NVDA
CYBR
CAVA
SFM
TKO
GOLD/GLD (crowded longs )
RDDT
MSFT
AMZN
PYPL

QQQ Testing Key Support & Anchored VWAPQQQ has pulled back from recent highs toward a confluence of technical levels around 500. This area lines up with a notable horizontal support zone, a 0.382 Fibonacci retracement of the prior upswing, an anchored VWAP from a recent swing low, and is in close proximity to the 150-period EMA. These overlapping factors could provide insight into near-term market behavior.
Key Observations
Confluence at 500: Horizontal support, 0.382 Fib retracement, anchored VWAP, and the nearby 150 EMA all converge at this level.
Recent Pullback: QQQ’s multi-day decline has brought it into this zone, making price behavior here potentially significant.
Market Reaction: How price interacts with this confluence could reveal shifts in buying or selling pressure, as reflected in volume and candlestick patterns.

QQQ: Long Trade with Entry/SL/TP
QQQ
- Classic bullish setup
- Our team expects bullish continuation
SUGGESTED TRADE:
Swing Trade
Long QQQ
Entry Point - 508.17
Stop Loss - 501.12
Take Profit - 522.71
Our Risk - 1%
Start protection of your profits from lower levels
❤️ Please, support our work with like & comment! ❤️

QQQ - support & resistant areas for today Feb 28, 2025The following key support and resistance levels for QQQ have been established for today. These levels are critical as they denote areas where price movements may experience reversal or consolidation. A rebound from these support or resistance zones can indicate potential long (buy) or short (sell) positions for traders.
The determination of these levels has been conducted through the application of mathematical models and forecasting techniques, ensuring their relevance for today's trading session. It is important to note that these levels are applicable solely for today and may be subject to change in subsequent trading sessions.
Should you find this information valuable and wish to receive similar insights each morning at 9:30 AM, I kindly request your support by boosting this post and following my updates. Your engagement is instrumental in helping m

QQQ in Buy ZoneMy trading plan is very simple.
I buy or sell when at three of these events happen:
* Price tags the top or bottom of parallel channel zones
* Money flow spikes beyond it's Bollinger Bands
* Stochastic Momentum Index (SMI) at near oversold overbought level
* Price at Fibonacci levels
So...
Here's why I'm picking this symbol to do the thing.
Price in buying zone at bottom of channels
Stochastic Momentum Index (SMI) at oversold level
Money flow momentum is spiked negative and under at bottom of Bollinger Band
Entry at $502
Target is upper channel around $540
2/27/25 - $qqq - bottom.2/27/25 :: VROCKSTAR :: NASDAQ:QQQ
bottom.
everyone thinks it's the beginning of the end
i'm finally going long w/ leverage ST stuff
this was the NVDA leverage flush we were looking for post EPS (see last QQQ note)
V

$QQQ Getting Over Sold?NASDAQ:QQQ I am stalking a bounce on the Q’s. From an intraday high (all time high) to an intraday low on this chart is about 6.2%. I would expect at least a dead cat bounce in the short term, but the market may not deliver for me. Having said that, I have an alert set on this 30-minute chart on the Downtrend line. “If” that triggers, I will go to a 5- or 10-minute chart to see if there is a good risk reward entry. And if I take the trade, it will be meant to be a day trade (of which I am not a fan) but it could turn to a swing trade “if” it gives me at least a 2% cushion.
I know I have a lot of "ifs" on this one, but isn't that the way it is?
I had posted another chart on the NASDAQ:QQQ index with a link below. I had said in that one that a pullback to the 510 “area” would not negate the longer-term uptrend. But one must be open to all outcomes.

QQQ: Buying opportunityOn QQQ we have a buying opportunity. You can enter a buying position as soon as the vwap breaks.

QQQ - support & resistant areas for today Feb 27, 2025So these are the support and resistant points for QQQ. Bounce off on these areas can initiate long or short positions.
This levels are mathematically calculated with future forecasting for the day. Only valid for the day.
If yall want me to post this every morning 9.30am please boost and follow me, so i know it is valuable for yall. If this post doesn't get more than 10 boosts, I will not continue this daily.
Thank you

QQQ at a Key Support! Will Tech Bulls Step In or More Downside? Technical Analysis for February 27, 2025:
1. Current Price Action:
* QQQ has pulled back and is trading near $513, attempting to stabilize around POC (Point of Control) at $514.49.
* The downtrend remains intact, but there are early signs of a possible base forming near $509-$510.
* A break above $520-$522.50 would shift momentum to the bulls.
2. Key Levels to Watch:
* Support: $509.44 (Current support), $500 (Major downside risk).
* Resistance: $520 (Breakout level), $527.50 (Critical resistance).
* Upside Targets: $530, $540, $550.
3. Indicators Analysis:
* MACD: Bearish, but momentum is slowing down.
* Stoch RSI: Moving higher, signaling a potential short-term bounce.
* Volume Profile: High liquidity near $514-$520, suggesting a battle zone between bulls and bears.
GEX & Option Strategy for Tomorrow and the Week:
1. Gamma Exposure (GEX) Insights:
* Call Walls: $530, $540 → Major resistance.
* Put Walls: $510, $500 → Key downside support.
2. IV & Sentiment:
* IVR: 31.3 (Low)
* IVx Avg: 30.2 (Stable)
* Put Positioning: 63.8% bearish sentiment.
* GEX Sentiment: Heavily bearish, but a reclaim of $520 could trigger a shift.
3. Trading Suggestions:
* Bullish Setup: If QQQ reclaims $520, consider long positions targeting $527-$540, with a stop at $515.
* Bearish Setup: If QQQ fails to hold $510, short setups targeting $500, stop at $515.
* Options Play: Selling put spreads at $500 or call spreads near $540 resistance.
📌 My Thoughts & Suggestion:
* QQQ is sitting at key support ($509-$510)—holding here could lead to a bounce toward $520+.
* If QQQ breaks below $509, expect more downside toward $500.
* Volatility remains low, making directional long options attractive.
⚠️ Disclaimer:
This analysis is for educational purposes only and does not constitute financial advice. Always do your own research and manage your risk before trading. 🚀

QQQ running out of steam?Seems to me that QQQ is starting to run out of steam. The strong AI rally seems like it may have reached peak FOMO and the Trump chaos is taking its toll. Trump's policies will likely be good for businesses and stocks in the long run if they don't put economy in a recession first. Any data showing that inflation is ramping back up will be bad. Typically markets prefer stability and not chaos. Either way, QQQ is trending flat and running at long term market resistance. Bubbles can always go higher, but something like the dot.com just rallied on upwards after short strong pullbacks. The AI bubble clearly looks like it is flat lining. We could continue to grind it out sidesways and upwards. A long-term sideways move could also give QQQ the headroom for a bigger run up later without a big pull back. Going to be a fun ride the next few months.

Markets have Bottomed - Here's WHY!I believe Markets have Bottomed - Here's WHY! NASDAQ:QQQ AMEX:SPY AMEX:IWM CBOE:MAGS TVC:VIX
In this video, I will go over what I believe is going on in the markets and where we will go next from here.
Doing all this while looking at all the probabilities and what they are telling us.
Not financial advice

QQQ - support & resistant areas for today Feb 26, 2025So these are the support and resistant points for $QQQ. Bounce off on these areas can initiate long or short positions.
I see IV is high today for QQQ in the opening. Maybe I will wait till the afternoon for options.
If yall want me to post this every morning 9.30am please boost and follow me, so i know it is valuable for yall. Thank you

QQQ 3-Year Correction Overdue Since 2015 the Nasdaq Index has undergone approximately 25% corrections from all-time-highs every 3 years. Over this time period, the price has more or less respected the trend lines shown above. But perhaps a force more powerful than the trendline is the timeline.
The pattern repeats at roughly 39-month intervals from top to top:
May '12 - July '15 (1175 days)
pivot from 5/1/12 ATH, 12%* correction over 35 days
July '15 - October '18 (1170 days)
pivot from 7/20/15 ATH, 26% correction over 34 days
October '18 - November '21 (1148 days)
pivot from 10/1/18 ATH, 24% correction over 84 days
November '21 - February '25 (1176 days)
pivot from 11/22/21 ATH, 38%** correction over 324 days
February '25 - May '28
pivot from 2/18/25 ATH, ??% correction
If the pattern holds true, we were due a correction last week. My guess is we'll double-top December's ATH and then start the correction. How deep for how long is anyone's guess. Feels more like '21 insanity than '15 or '18 to me.
Notes:
*2012 (I believe) not yet representative of participation in the trendline pattern (still recovering from Great Recession)
**This particular correction was covid-anomolous (we were 24% above the channel already when we pivoted). This particular -38%, 324-day correction was more like 3-in-1: -22% in 97 days, -27% in 80 days, -24% in 59 days. You may get a better pattern predictor if you average the 3 moves, so -24% over 77 days. Alternatively, you can see it as two moves: an intial -22% move to bring it back within the channel, followed by a second -24% move to bring it to the bottom of the channel.
