QQQ forming a H+S patternPurely speculative just like the rest of you.
Looking like the head is forming. Left shoulder already there. Expecting a drop down to 503 (approx) neckline area. Bounce back up to form the right shoulder, then right around when Trump takes office that's when the pattern plays out all the way down to about 486 (approx)
QQQ trade ideas

Top 5 Weekly Trade Ideas #2 - QQQ TriangleQQQ opening near the top end of its triangle. Looking for a break above which should lead to a move up to ATH. We also have a longer term trendline that will be potential resistance shortly above. If we can clear all of that, I'd look for a rejection at ATH for a potential long on the trendline retest as shown above.
If it can't break, downside target would be the gap fill below.

QQQ Approaches Critical Resistance: Is a Breakout or Reversal?QQQ is trading near significant resistance levels after a strong rally. Here's a comprehensive analysis and trading plan to help traders navigate the current price action.
1️⃣ Price Action & Chart Analysis
* Trend Overview: QQQ is in a rising wedge pattern, which often signals potential exhaustion of the current uptrend.
* Key Levels:
* Resistance: $518.30 (current high), $525.00 (psychological resistance).
* Support: $513.30 (recent breakout level), $511.40 (previous strong support).
The current price is testing the upper trendline of the wedge, indicating a crucial area for decision-making.
2️⃣ Liquidity Zones & Order Blocks
* Liquidity Zone: Watch for price activity between $516.00–$518.30, where sellers could gain strength.
* Order Block: Strong demand identified near $511.00–$513.00 from prior accumulation.
3️⃣ Scalping Strategy
For intraday opportunities:
* Entry (Breakout): Buy above $518.50 if volume confirms the breakout. Target $520.50–$522.00.
* Stop-Loss: Below $517.00 to limit losses.
* Rejection Play: If $518.30 acts as resistance, consider a short trade targeting $515.00–$513.30.
4️⃣ Swing Trade Strategy
For multi-day setups:
* Entry Option 1: Go long on a confirmed breakout above $518.30 with increasing volume.
* Entry Option 2: Wait for a pullback to $513.00–$515.00 for better risk-reward.
* Targets:
* Initial Target: $525.00
* Extended Target: $530.00
* Stop-Loss: Below $511.00 for a more conservative approach.
5️⃣ Momentum & Indicators
* MACD: Positive momentum persists but shows signs of weakening, hinting at potential consolidation or pullback.
* Volume: Slightly decreasing volume may indicate hesitation among buyers.
Game Plan for Tomorrow
* Scenario 1: A breakout above $518.30 with strong volume could lead to further upside toward $525.00.
* Scenario 2: Rejection at $518.30 might result in a pullback to $513.00 or lower.
Disclaimer:
This analysis is for educational purposes only and not financial advice. Always perform your own research and consider your risk tolerance before trading.

Opening (IRA): QQQ December 20th 425 Covered Call... for a 421.94 debit.
Comments: As with my IWM covered call, re-upping in QQQ at a strike higher than the one I just took off in an attempt to capture the next increment of the up move that I missed out on.
I'm not expecting a ton out of this (the max is 3.06), but that's okay, since I'm not yet ready to go all the way out to January yet anyhow.

$QQQ - MOre highs above $515.3QQQ - ETF broke all time highs today but closed below $515.3 resistance. Looking for calls if that level breaks again. Stock has flat top at this level. Price target of $520 and $530. Stock is strong on indicators.

Delusional Bulls? $QQQIt's really hard to ignore this. People screaming new highs!! Like what?! This is basic no? We'll find out on the next episode of Dragonball Z.

QQQ Analysis: Scalping and Swing Trade Strategies for Dec. 3QQQ has displayed strong bullish momentum, breaking out of its recent consolidation. This analysis provides a detailed trading plan, highlighting critical support and resistance levels, price action insights, and actionable strategies for both scalping and swing trading.
Technical Analysis and Price Action
1. Trend Overview:
QQQ has broken out of its descending channel, signaling bullish strength. The MACD confirms upward momentum, with volume increasing on the breakout.
2. Key Support & Resistance Zones:
* Support Levels:
* Primary: $511.35 (previous resistance, now turned support).
* Secondary: $510.11 (gap-fill level).
* Resistance Levels:
* Immediate: $516.26 (current high).
* Strong Resistance: $520.00 (psychological level and previous supply zone).
3. Liquidity Zones and Order Blocks:
* Buyers are concentrated at $511.35, suggesting strong demand.
* Sellers are active around $516.26, indicating a supply zone.
Game Plan and Playbook
Scalping Strategy
* Entry:
* Long: Above $516.26 with confirmation of strong volume.
* Short: Below $511.35 if breakdown occurs.
* Targets:
* Long Target: $518.00 (minor resistance) and $520.00 (major resistance).
* Short Target: $510.11.
* Stop Loss:
* Long: $515.00 (below breakout level).
* Short: $512.50 (above breakdown level).
Swing Trading Strategy
* Bullish Setup:
* Entry: Retest of $511.35 with bullish candlestick confirmation.
* Target 1: $520.00.
* Target 2: $525.00 (extension level).
* Stop Loss: $509.00 (below support).
* Bearish Setup:
* Entry: Breakdown below $510.11 with increased selling volume.
* Target 1: $502.00 (previous consolidation support).
* Target 2: $495.00.
* Stop Loss: $512.50.
Projection: Where QQQ Could Head Next
QQQ appears poised to test the $520.00 level if it sustains above $516.26. Failure to hold above $511.35 could trigger a pullback to $510.11 or lower. Volume will be critical in confirming the direction.
Key Indicators to Watch
* MACD: Bullish crossover supports further upside.
* RSI: Near overbought, signaling potential caution at higher levels.
* Volume: Watch for spikes to validate breakout or breakdown scenarios.
My Thoughts and Suggestions
QQQ is showing strong bullish momentum, but traders should exercise caution near resistance levels. Scalpers can capitalize on intraday volatility, while swing traders should wait for a retest of support or confirmation of a breakout. Patience is key to avoiding false breakouts.
Conclusion
The Nasdaq-100 ETF offers compelling opportunities for traders, with clear setups for both bulls and bears. By adhering to a structured plan, traders can maximize their edge while minimizing risk.
Disclaimer
This analysis is for educational purposes only and does not constitute financial advice. Always conduct your own research and manage risk carefully.

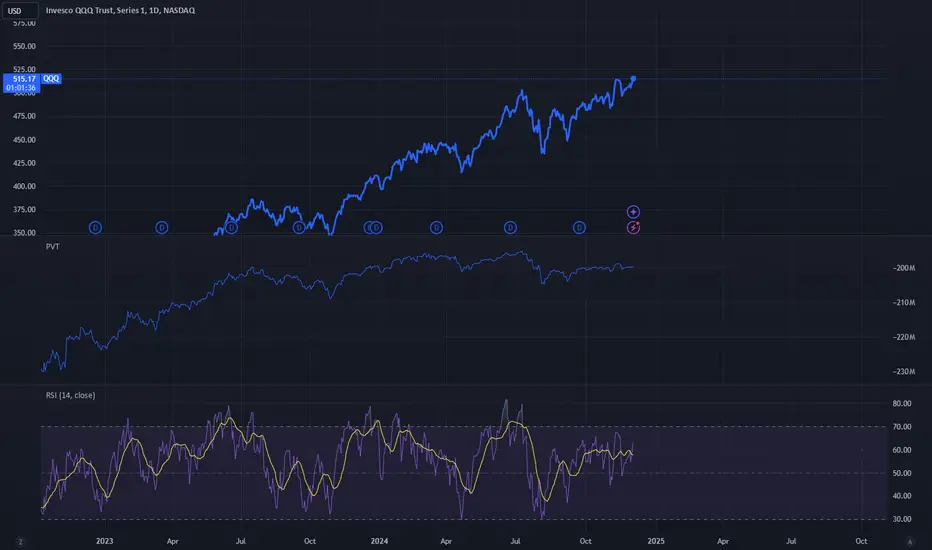
Heavy Bearish Divs On QQQ, But...QQQ is sending clear warning signs in the form of strongly pronounced bearish divergences in the RSI, price-volume trend and other indicators. Of course, this does not necessarily mean that the market will now fall significantly. But if you look at other assets, you will see that the more pronounced the divergences, the greater the price movements.
What should we look out for now?
First of all, seasonality, which is very bullish here at the end of the year and usually in January too. We are looking at the daily chart here, so it may take some time for the divergences to ignite. Subsequently, a downward trend should establish itself in the subordinate time frames. The H1-H2 chart should be kept in view here. A pullback should then be awaited in order to find a favorable entry point.
What we can say for sure: The bull train is currently still in full swing. We know that many traders are observing the divergences, but one should not try to short the high due to the seasonality. When the bears return, there will be time enough for considered entries.
Last Correction for the Year and then we go back to sub 3% IR.We should see 1 more last correction during the holiday season before President Trump gets inaugurated. This might be one of the last golden eras where a president suppresses interest rates one last time to try to make the economy flourish again in these next 4 years. These last 4 years was a repeat of the 1970s great inflation with Jimmy Carter except now its with Joe Biden but instead of Donald Trump having a Paul Volcker fed chairman he has a very indecisive Jerome Powell whom will just kick inflation further down the road (via cutting interest rates back to sub 3%) for the next Fed chairman to deal with in 2026.

QQQ – Testing Resistance: Breakout or Fakeout?QQQ is testing a critical resistance level near $510, trading within a rising wedge pattern that suggests potential for both breakout and pullback scenarios. This analysis delves into key levels, technical indicators, and trade setups to navigate QQQ's next move.
Market Structure & Price Action:
* Recent Trend: QQQ has rebounded from the $494 support zone and is now retesting the upper resistance at $510.
* Liquidity Zones:
* Strong buyer activity near $501–$503.
* Sellers are concentrated at $510–$511, marking the top of the current range.
* Volume Profile: Volume has picked up during the upward push, but the absence of a clear breakout signal suggests caution.
Key Levels:
1. Resistance Zones:
* $510–$511: Immediate resistance and potential breakout zone.
* $515: Next target upon a successful breakout.
2. Support Zones:
* $503: Immediate support within the range.
* $494: Strong demand zone, acting as a floor for recent pullbacks.
Indicators:
* MACD (1-hour): Bullish momentum with a crossover, though the histogram is flattening, suggesting a slowdown.
* Volume: Watch for a volume spike at $510 to confirm a breakout or rejection.
Trade Ideas:
1. Scalping Setup:
* Entry (Long): Above $511 with confirmation of a breakout (volume surge and strong bullish candles).
* Target: $513–$515.
* Stop-Loss: Below $509.
* Short Setup: If rejected at $510, short below $509 targeting $503, with a stop above $511.
2. Swing Trading Setup:
* Bullish Case:
* Entry: On a breakout above $511.
* Target 1: $515.
* Target 2: $520.
* Stop-Loss: Below $509.
* Bearish Case:
* Entry: Short below $503.
* Target 1: $498.
* Target 2: $494.
* Stop-Loss: Above $505.
Thoughts & Outlook: QQQ is at a pivotal point, with $510 acting as a make-or-break level. A breakout above $511 could lead to significant bullish momentum, targeting $515 or higher. Conversely, rejection at $510 would suggest a move back to $503 or lower, offering opportunities for both scalpers and swing traders.
Disclaimer: This analysis is for educational purposes only and does not constitute financial advice. Please conduct your own research and trade responsibly. Trading involves risk.

Stock Market | TSLA NVDA AAPL AMZN META GOOGL MSFTStock Market | TSLA NVDA AAPL AMZN META GOOGL MSFT
Nvidia Stock NVDA Forecast Technical Analysis

Measured Moves: A Guide to Finding TargetsMeasured Moves: A Guide to Finding Targets
Visualizing the boundaries of price movement helps anticipate potential swing points. The concept of measured moves offers a structured framework to estimate future price behavior, based on the observation that each swing move often mirrors the size of the previous one, assuming average price volatility remains consistent. While not exact, this approach provides a practical method to approximate the extension of a swing move.
Background
Determining profit targets across various methods and timeframes can be challenging. To address this, I reviewed the tactics of experienced traders and market research, noting key similarities and differences. Some traders relied more on discretion, while others used technical targets or predetermined risk-to-reward ratios. Levels of support and resistance (S/R) and the Fibonacci tool frequently appeared, though their application varied by trader.
Based on current evidence, levels appear most relevant when tied to the highest and lowest swing points within the current price structure, for example in a range-bound market. In contrast, sporadic or subtle levels from historical movements seem no more significant than random points. The Fibonacci tool can provide value since measurements are based on actual price range; however, the related values have limited evidence to support them.
To explore these ideas, I conducted measurements on over a thousand continuation setups to identify inherent or consistent patterns in swing moves. It’s important to emphasize that tools and indicators should never be used blindly. Trading requires self-leadership and critical thinking. The application of ideas without understanding their context or validity undermines the decision-making process and leads to inconsistent results. This concept formed the foundation for my analysis, ensuring that methods were tested rather than taken at face value.
Definitions
Trending price movement advances in steps, either upward or downward. This includes a stronger move followed by a weaker corrective move, also known as a retracement.
When the corrective move is done and prices seem to resume the prevailing trend, we can use the prior move to estimate targets; this is known as a projection.
For example, if a stock moves up by 10%, pauses, and subsequently makes another move, we can utilize that value to estimate the potential outcome. Well thats the idea..
Data
Through manual measurements across various timeframes, price structures, and stock categories, I have gathered data on retracements and projections. However, this information should not be considered precise due to market randomness and inherent volatility. In fact, deviations—such as a notable failure to reach a target or overextensions—can indicate a potential structural change.
As this study was conducted with a manual approach, there is a high risk of selection bias, which raises concerns about the methodology's reliability. However, it allows for a more discretionary perspective, enabling observations and discretion that might be overlooked in a purely automated analysis. To simplify the findings, the presented values below represent a combination of all the data.
Retracement Tool
In the context of price movements within a trend, specifically continuation setups, retracements typically fall between 20% and 50% of the prior move. While retracements beyond 50% are less common, this does not necessarily invalidate the setup.
From my observations, two distinct patterns emerge. First, a shallow retracement where the stock consolidates within a narrow range, typically pulling back no more than 10% to 20% before continuing its trend. Second, a deeper retracement, often around 50%, followed by a nested move higher before a continuation.
For those referencing commonly mentioned values (though not validated), levels such as 23.6%, 38.2%, 44.7%, and 50% align with this range. Additionally, 18% frequently appears as a notable breakout point. However, I strongly advise against relying on precise numbers with conviction due to the natural volatility and randomness inherent in the market. Instead, a more reliable approach is to maintain a broad perspective—for example, recognizing that retracements in the 20% to 50% range are common before a continuation. This approach allows flexibility and helps account for the variability in price action.
Projection Tool
When there is a swing move either upward or downward, we can utilize the preceding one of the same type for estimation. This approach can be used exclusively since it is applicable for retracements, projections, and range-bound markets as long as there has been a similar price event in recent time.
In terms of projection, the most common range is between 60% and 120% of the prior move, with 70% to 100% being more prevalent. It is uncommon for a stock to exceed 130% of the preceding move.
Frequently mentioned values in this context include 61.8% and 78.6% as one area, although these values are frequently surpassed. The next two commonly mentioned values are 88.6% and 100%, which are the most frequent and can be used effectively on their own. These values represent a complete measured move, as they closely mimic the magnitude of the prior move with some buffer. The last value, 127%, is also notable, but exceeding this level is less common.
Application
The simplest application of this information is to input the range of 80% to 100% into the projection tool. Then, measure a similar prior move to estimate the subsequent one. This is known as the measured move.
There are no strict rules to follow—it’s more of an art. The key is to measure the most similar move in recent times. If the levels appear unclear or overly complicated, they likely are. The process should remain simple and combined with a discretionary perspective.
Interestingly, using parallel channels follows the same principle, as they measure the range per swing and project average volatility. This can provide an alternative yet similar way to estimate price movement based on historical swings.
The advantage of this method is its universal and adaptable nature for setting estimates. However, it requires a prior swing move and is most effective in continuation setups. Challenges arise when applying it to the start of a new move, exhaustion points, or structural changes, as these can distort short-term price action. For instance, referencing a prior uptrend to project a downtrend is unlikely to be effective due to the opposing asymmetry in swing moves.
In some cases, measured moves from earlier periods can be referenced if the current range is similar. Additionally, higher timeframes take precedence over lower ones when determining projections.
This is nothing more than a tool and should be used with a discretionary perspective, as with all indicators and drawing tools. The true edge lies elsewhere.
Example Use
1. Structure: Identify an established trend or range and measure a clear swing move.
2. Measured Move: Apply the measurement to the subsequent move by duplicating the line to the next point or using a trend-based Fibonacci extension tool set to 100% of the prior swing.
The first two points define the swing move.
The third point is placed at the deepest part of the subsequent pullback or at the start of the new move.
3. Interpretation: While this is a simple tool, its effective use and contextual application require experience and practice. Remember, this process relies on approximation and discretionary judgment.

QQQ A Fall Expected! SELL!
My dear friends,
Please, find my technical outlook for QQQ below:
The instrument tests an important psychological level 505.79
Bias - Bearish
Technical Indicators: Supper Trend gives a precise Bearish signal, while Pivot Point HL predicts price changes and potential reversals in the market.
Target - 502.68
About Used Indicators:
Super-trend indicator is more useful in trending markets where there are clear uptrends and downtrends in price.
———————————
WISH YOU ALL LUCK

QQQ: Bearish Forecast & Outlook
The recent price action on the QQQ pair was keeping me on the fence, however, my bias is slowly but surely changing into the bearish one and I think we will see the price go down.
❤️ Please, support our work with like & comment! ❤️

$QQQ IS IT TIME TO JUST WATCH MARKET?Will be taking some profit! I am posting this chart to see how my trendline will workout!

Elliott Wave View: Nasdaq ETF (QQQ) Looking for More DownsideRally in Nasdaq ETF (QQQ) from 10.13.2022 low is in progress as a 5 waves impulse. Up from 10.13.2022 low, wave ((1)) ended at 296.88 and wave ((2)) ended at 259.73. The ETF extended higher and ended wave ((3)) at 516.73 as 45 minutes chart below shows. Wave ((4)) pullback is in progress and the current decline is unfolding as a zigzag. Down from wave wave ((3)), wave ((i)) ended at 509.83 and wave ((ii)) rally ended at 514.98. Wave ((iii)) lower ended at 494.49 and wave ((iv)) rally ended at 502.14. Final leg lower wave ((v)) ended at 494.11 which completed wave A.
The ETF then rallied in wave B with internal subdivision as a double three Elliott Wave structure. Up from wave A, wave (a) ended at 505.25 and wave (b) pullback ended at 496.56. Wave (c) higher ended at 506.96 which completed wave ((w)). Pullback in wave ((x)) ended at 497.56. The ETF extended higher in wave ((y)). Up from wave ((x)), wave (a) ended at 506.34 and pullback in wave (b) ended at 502.1. Wave (c) higher ended at 511.45 which completed wave ((y)) of B. The ETF has turned lower in wave C. Near term, as far as pivot at 516.67 high stays intact, expect rally to fail in 3, 7, 11 swing for further downside.

QQQ Market Structure Update, Short Setup👋Hello Traders,
Our 🖥️ AI system detected that there is a H4 or higher timeframe, a Short Setup in
QQQ for swing trade (a couple of days)
We are waiting for a retest with less buying power under the Supply Zone before Swing Short trade this week.
For more ideas, you are welcome to visit our profile in tradingview.
Have a good day!
Please give this post a like if you like this kind of simple idea, your feedback will bring our signal to next better level, thanks for support!

QQQ ALT target 511 to 516 The chart posted is the only Bullish wave count .If this does not break the 500 then We have a LAST GASP in Wave 5 in a expanding triangle

The US Treasury 2-year and 10-year spread never lies.The US Treasury 2-year and 10-year spread never lies.
Of course, this is based on historical data, as whenever the spread between the 2-year and 10-year bonds turns positive from a negative value, it is typically followed by stagnation in the bond market.
However, alongside this, we cannot ignore several important factors:
1. "Trump's trade", as such, did not take place, and the market considers it overestimated, showing no desire to buy more.
2. Inflation and the resulting monetary policy continue to create unpredictability.
3. The ongoing escalation of the Russia-Ukraine war and the overall geopolitical situation are not conducive to further growth.
4. The potential wave of protectionism, which would ignore soft fiscal policies.
5. ...
6. ...
7. ...

$QQQ Trading Range for 11.26.24We’ve been trading in an upper channel and with the way options look tomorrow we probably stay within that channel. Implied move is between 502 and 511, 35 EMA and 30 minute 200 MA moving together, which could keep price close to those two levels though if the 35 EMA does break down, then looked 502 underneath the entire thing we’ve got that one hour two under moving average, which has been holding us support all of last week so likely it will hold for Thanksgiving week as well
Tonight’s video was awesome about showing how to trade this set up.

$QQQ: OUTLOOKNASDAQ:QQQ : OUTLOOK
Eyes on NASDAQ:QQQ tomorrow — I'm watching for a potential new ALL-TIME HIGH!💥
If the TREND CONTINUES, we’ll be heading straight toward my LIQUIDITY TARGET.
But if the trend breaks, we could see a dip to my GOLDEN ZONE to find a bottom.
👉 LIKE & FOLLOW for more updates and trade insights!

$QQQ Trading Range for TodayAll right, we have an opening move to the top of the implied move and a pull back down to the gaps that were the island top that were resistance last week. We’re dropping it now. Looks like it wants to fill man. I wish I was more prepared to trade this one this one looks like fun. 30 minute to average and 35 EMA underneath us those should be targets and the implied movies between 50 one and 510 so far we are in the implied move

QQQ Technical Short OpportunityTechnical SHORT opportunity in QQQ:
1. QQQ failed to fill gap from Friday. Very weak upward progression over the last 4 days
2. Thursday’s candle is a “bearish hanging man”
3. The last bearish wave retraced 66% of the prior upward move
4. There have been multiple tests of immediate support level (495-498)
5. QQQ has been weaker than S&P over the past 5 days
Profit target can be placed near the high-volume node at 488
Please note that the long-term trend remains “bullish,” and a short-term downside auction does not indicate an immediate reversal.
