QQQ trade ideas

Buy the Dip!!Price action bearish but rotational in nature. I am targeting the 50MA which coincides with the top of my long term channel to buy back in.

$QQQ TIMBBBEEERRRRSSSHere we go what goes up must come down I believe its the law of gravity IDK im working on my alchemy. Remember Sell Retail and Buy Wholsale until you see it the other way... keep up

QQQ WHERE WILL IT GO.I think for QQQ we retrace up tomorrow to the 485 level then reject and drop back down.
My bullish case is if it breaks above 485 we head to 488.
A break above 488 we fill the 496 gap by end of the next week.
To confirm a true down trend in the short term we need to break 480 level.

The Nasdaq100 $QQQ to $465 by August 1st - PUT$!The Nasdaq100 NASDAQ:QQQ is having its worst day in months. We've known that a significant correction in BIG tech (The Mag-7) was coming. We didn't time it perfectly, but we timed it pretty darn well, and now, we're reaping the lucrative rewards of being RIGHT!
Our 7/19 $77 NASDAQ:TQQQ put options nearly 7X'd this morning. I never "like" trading contracts with expirations that close, but what we've seen today provided a great example of how much reward they can carry if you're willing to take the risk.
That's also why I chose to push back the dates on my new NASDAQ:TQQQ put position to 8/9. I ultimately believe that the NASDAQ:QQQ could be playing out this head and shoulders pattern that will bring it down to $465 by August 1st. That said, I plan to sell a bunch of contracts once/ if we see $474, then re-purchase them around here ($482-$484).
I don't want to spend too much time celebrating, but in my opinion, it's necessary to take a victory lap when it's deserved. Congrats team. This market hasn't been easy to trade, but we've absolutely nailed it this week.

Elliot Wave Analysis/Prediction of QQQ Chart (Monthly Timeframe)Overview
The Invesco QQQ Trust (QQQ) chart presents a well-defined Elliott Wave structure over the long term, suggesting a robust bullish trend. Additionally, the RSI is indicating interesting channel movements that reflect changes in market momentum.
Key Points:
Elliott Wave Analysis:
The chart displays a clear Elliott Wave pattern:
Wave I started the initial uptrend ($168-$407)
Wave II was a corrective phase, resetting the trend. ($407-$254)
Wave III marked a significant bullish run, reaching new highs. ($254-$550expected)
Wave IV will be a minor corrective phase with support around $450-410 before the anticipated Wave V.
The potential for Wave V suggests further upward movement, continuing the long-term bullish trend. From the lows of Wave IV, we expect to see 80% appreciation before May 2027
RSI Trend:
The RSI is currently around 72.00, which is in the overbought territory, indicating strong bullish momentum.
The RSI has been moving within a rising channel, suggesting increasing momentum over the recent months.
Historical RSI movements show that the QQQ tends to pull back slightly when RSI reaches these levels before continuing the upward trend.
Support and Resistance:
Immediate support can be found around the $450-$410 level, aligning with the previous consolidation zone and the potential Wave IV corrective phase.
Resistance is projected at the current all-time high around $483, with further potential to reach higher levels if Wave V unfolds as expected.

Consolidation or potential CorrectionThis chart displays the price movement of the Invesco QQQ Trust (QQQ), which tracks the Nasdaq-100 index, over a period from early 2023 to July 2024. Here's an analysis of the key points:
1. Overall Trend: The QQQ has shown a strong upward trend since early 2023, with the price rising from around $260 to over $480, representing a significant gain of about 85%.
2. Recent Performance: As of July 17, 2024, the QQQ is trading at $483.20, down 2.62% (-$13.00) on the day, indicating some recent pullback.
3. Notable Movements:
- A sharp decline of 9.08% (-$28.49) over 26 days in early 2023.
- A significant rally of 24.97% ($77.24) over 57 days in spring 2023.
- Another substantial gain of 31.25% ($106.99) over 100 days from late 2023 to early 2024.
- The largest gain shown is 21.75% ($89.79) over 55 days in the most recent period.
4. Volume: The trading volume (shown at the bottom) has generally decreased over time, with recent volume lower than in early 2023. This could indicate decreasing volatility or investor interest.
Current Outlook: The most recent price action shows a slight downturn after reaching new highs, which could be a short-term correction or the beginning of a larger pullback.
This analysis suggests that while the QQQ has performed exceptionally well over the past year and a half, it may be entering a period of consolidation or potential correction. Investors should monitor for continued support at current levels or signs of further decline.

QQQ - Trump Rally Fading Here - Where are we at?As mentioned if it appeared like Trump was going to win we would get a rally but it would fizzle out and fade. We are what I believe starting to fade.
I am short 200 shares @ 476.42 Avg
I am short 2 JUL19 495 Calls @ $6.64 each which are now trading at $0.34.
Only 2 days left I am going to just hold the calls to expiration, it is looking good to expire worthless but there is no reason also not to just close them out and take your money and run ($1260).
I would like to see a setup on the daily here to add another position or sell more Calls so simply going to wait. Would be reasonable to see a bounce tomorrow and that is where I am looking to short.
Bottom line, The Big 7 are a good hiding spot, but now that the election is becoming more and more clear, look for that rotation into energy stocks and also a few like CAT and DE.
I am also looking at some beat up Biotech stocks as well.
Happy trading!!!

07/17 QQQ ATR Levels and RangeCurrent ATR showing at 5.62 increasing ever so slightly from last week and so far increase for this week. Even tho there is downside action creating most of the increase, its still an increase alal together.
Last months High was 487.2 Needing to seriously defend this level this could be a possible bounce area, if not we find the high 486 level for a bounce.
Preferable to keep within this quarter I would like to see a bounce at 488.30 to push up thru -to 490.70 (Last weeks low)
If we open above 489.08 we could find some resistence at 492, 493 range (this weeks low) if the want to take it higher, they may form a channel between 493.80 to 496.38/57/72 for yesterdays close, after hours high and premarket high.
Whatever the possibilities are, I am looking for price action and volume.

Daily Recap - Small Account Challenge QQQ AMD PLTRA recap of today's action. Great day for the Dow and Russell, but pretty quiet for NQ. I was fairly bearish going in to today, but ended up bullish by day's end. I'm trying to play it day by day and remain mostly neutral because I haven't been reading some of the recent action well when it comes to the next 1-2 weeks lately. I like to slow down and focus on day trades or some less risky swings when that happens.
I like the PLTR long, but still think it could be dangerous. We have cleared $27 and remained above, but we have a final obstacle here around $29. Seems like it could go either way, but maintaining bullish bias for now.

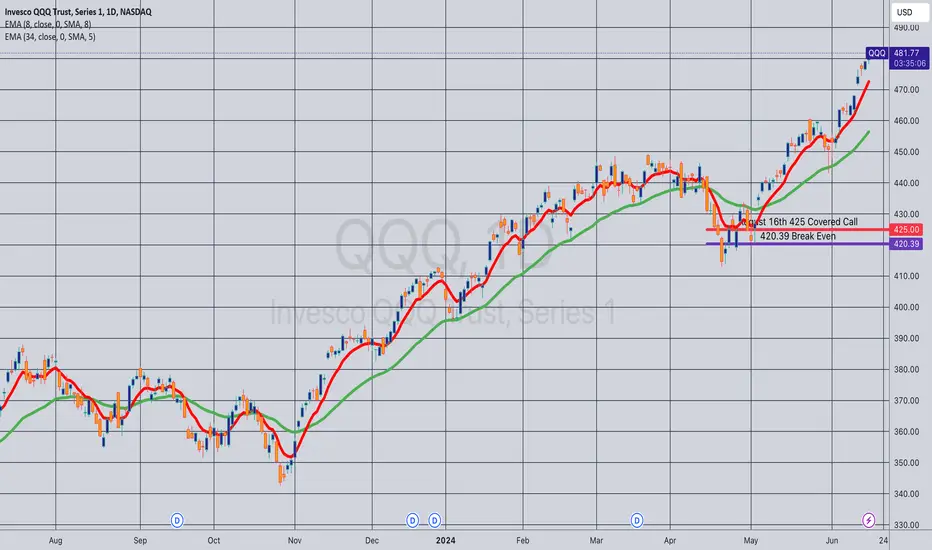
Opening (IRA): QQQ August 16th 425 Monied Covered Call... for a 420.39 debit.
Comments: After having taken profit on my August 16th 420 CC, re-upping, but at a slightly higher strike ... . The ROC %-age metrics aren't generally what I like to see out of these, but have already realized some gains in the August cycle, so am fine if the ROC %-age isn't stellar here. I'm also selling the -85 delta call against, as opposed to my usual -75.
Metrics:
Break Even/BPE: 420.39
Max Profit: 4.61
ROC at Max: 1.10%
50% Max: 2.30
ROC at 50% Max: .55%
Market Watch: Analyzing QQQ and ITB PerformanceIn this week's market analysis, we're diving into the performance of Invesco QQQ Trust (QQQ) and the iShares U.S. Home Construction ETF (ITB) over the past five years.
**Orange Line**: ITB (iShares U.S. Home Construction ETF)
**Candlestick Chart**: QQQ (Invesco QQQ Trust)
Here's what stands out:
1. **ITB vs. QQQ Performance**:
- Over the last five years, ITB has shown impressive growth of 181.62%.
- QQQ has also performed remarkably, with a gain of 138.88%.
2. **Relative Strength Index (RSI)**:
- The upper RSI chart shows the RSI for QQQ, currently at 73.93, indicating an overbought condition.
- The lower RSI chart displays the RSI for ITB, at 57.39, suggesting it's in a more neutral zone.
3. **Trend Analysis**:
- Both ETFs experienced significant volatility during the COVID-19 pandemic, as seen in early 2020.
- Since then, QQQ has steadily recovered and reached new highs, while ITB has shown stronger but more volatile growth.
4. **Recent Movements**:
- Both ETFs have shown positive momentum recently, with ITB experiencing a sharper upward trajectory.
**Key Takeaways**:
- ITB has outpaced QQQ in percentage growth over the past five years.
- RSI indicators suggest that QQQ might be in an overbought zone, while ITB remains in a healthier range.
Stay tuned for more market insights and don't forget to follow for weekly updates!
#StockMarket #Investing #ETFs #QQQ #ITB #MarketAnalysis #TradingView #Finance #Stocks #Investment
---

07/15 QQQ ATR Levels and RangeWith the crazy event over the weekend and lite work on the reports side with the exception of Powell speaking at 1230... I DONT Know what to expect and will be watching the following levels. ATR currently sitting at 5.46, which is a slow increase.
If we can get over 497.50 area we could see the 500 trange again, maybe 503.50 area.
If we lose the 495 area we could go as low as 490.73
SCALP
SR2 498.53
SR1 497.82
SPOP 497.11
LAST PRICE 496.40
SBREAK 495.69
SS1 494.98
SS2 494.27
----------------
R2 503.50
R1 500.77
POP 499.13
LAST PRICE 496.40
BREAK 493.70
S1 491.54
S2 490.11

$QQQ Today's Trading Range After PPIAlright... and QQQ. I posted the others last night I was just too tired to finish so here is QQQ
Have a happy weekend, y'all!!

How to use Moving Averages like a proIn this video I describe how I use Moving Averages to trade and to stay in sync with the market. Popular Moving averages include the 9, 21, 50, or 200. Feel free to use Simple Moving averages or Exponential moving averages, both works fine, and I like to use the EMAs because they are a little quicker to respond to price movement. I also go over a trading strategy for going long or short in the market once the 50 EMA starts to change directions, I will take a position in that direction. So, if the 50 EMA goes down for a long time, I will take a long once it starts to point up. Thank you for watching!

07/12 QQQ ATR Levels and RangesBeen out of the pocket for the last 2 days, so I am just going to stick to my lines this morning no emphasis on a perspective or thesis. ATR is at 5.45 which is going up from prior month and from earlier this month. I do think that we go back up from this LOW LOW area we are experiencing, the PPI reports came out this am relatively flat, however a shave off a few tenths of a point is good in the economics world. tradingeconomics.com
SCALP
SR2 495.05
SR1 494.35
SPOP 493.64
LAST PRICE 492.93
SBREAK 492.22
SS1 491.51
SS2 490.81
R2 500.01
R1 497.29
POP 495.65
LAST PRICE 492.93
BREAK 490.23
S1 488.08
S2 486.65

Daily Recap - NQ Sell Off After CPIA recap of today's action, bears finally got some relief today, but we'll see if they keep up the momentum or not. I'm expecting at least a little more downside, but we'll see how tomorrow goes. The best thing about today IMO is that something interesting happened and there was a lot of trade setups which was great. Looking forward to tomorrow.

QQQ Nasdaq Drop Analysis July 11, 2024Everything that goes up must come down! Many people get scared on days like today when the NQ dropped around 10% out of nowhere, but if we expand the chart, we can see that since mid-April, the Nasdaq has only gone up and up! We call this a state of institutional liquidation.
Today, the CPI results were favorable, and there was no economic news that could have taken down the Nasdaq, so naturally, the market has to go down. The question is, for how many days? We really don't know, but if we average the last pullback, we can see that it will be at least 4 to 5 days.
Thank you.

QQQ Short TargetBig fakeout above that major trendline for QQQ. I see this as extremely bearish, I'd say it's likely to continue lower for at least a few days. Final target for this move for me is previous highs around $486

QQQ - Wave 5 underwayY'all gonna get rekt shorting this. Wave 5 underway. Might get another dip the next few weeks and then off to the moon. Targets based on various EW counts.

QQQ - Tapped out but looking for another TradeWhether you took the swing or the position trade, both were tapped out. This happens, part of trading, which is why we assign a risk to it.
Either way I am still hedged short here and looking to add one more position in the near term.
I am also looking for a trade if and when the setup takes place.
Currently I am short 200 shares and also short two (2) 495 Calls expiring July 19th.
Happy Trading

Short QQQ, Long IWM?The long tech trade seems to be coming to an end here. If we continue to reject this trendline, then I think the Mag 7 and Nasdaq trade could be over and you'll be better off longing "value" going forward.
On an individual stock basis, there's a number of names that look to be forming bottoms in the value space and a number of stocks (META, NFLX, NVDA, etc.) that all look to be forming tops.
Time to rebalance the portfolio around value?
The chart should be the guide should it reject and fall from here.

Small cap rotation starting??Today could (repeat COULD - not confirmed) be the start of a turn for a period of small cap outperformance vs large cap tech. Came within 5% of my long term target so QQQ/IWM could still just be just pausing before one more leg higher BUT there could be a big rotation starting!
