Elliott Wave Expects Nasdaq 100 (QQQ) to Continue HigherShort Term Elliott Wave in Nasdaq 100 ETF (QQQ) suggests it shows a bullish sequence from 4.20.2024 low favoring more upside. Up from 4.20.2024 low, wave 1 ended at 461.5 and pullback in wave 2 ended at 443.06. The ETF has extended higher in wave 3. Internal subdivision of wave 3 is unfolding as a nesting impulsive structure. Up from wave 2, wave (i) ended at 455.58 and wave (ii) ended at 447.9. Wave (iii) higher ended at 465.55 and pullback in wave (iv) ended at 460.54. Last leg wave (v) ended at 465.74 which completed wave ((i)) in higher degree. Pullback in wave ((ii)) ended at 461.5 and the ETF has extended higher.
Up from wave ((ii)), wave i ended at 465.19 and wave ii dips ended at 462.03. Then it rallied higher in wave iii towards 478.28 and wave iv pullback ended at 473.80. Last leg wave v ended at 478.95 which completed wave (i) in higher degree. The ETF then pullback in wave (ii) towards 474.42. Near term, as far as it stays above 461.51, expect pullback to find support in 3, 7, or 11 swing for further upside.
QQQ trade ideas

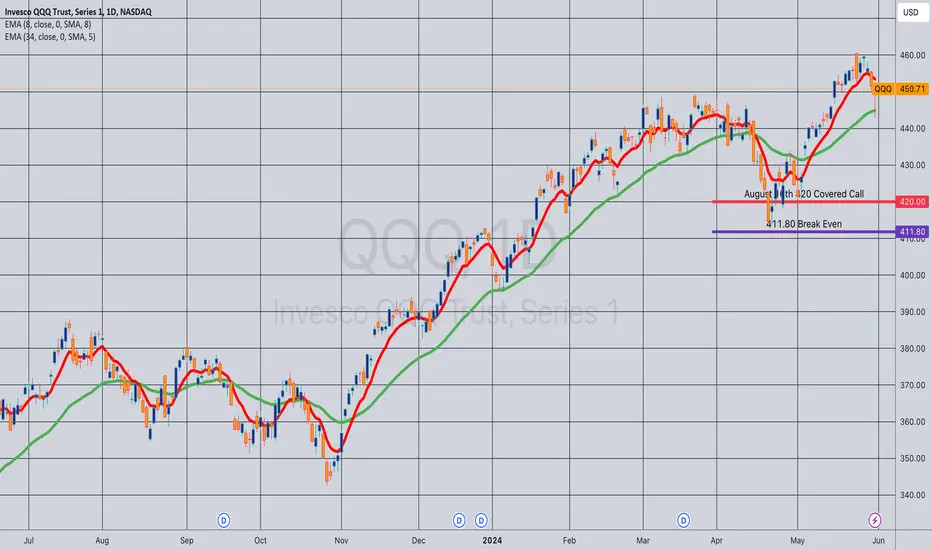
Opened (IRA): QQQ August 16th 420 Monied Covered Call... for a 411.80 debit.
Comments: (Late Post). Sold the -75 call against a one lot to emulate the delta metrics of a 25 delta short put, but with built-in short call defense.
Metrics:
Buying Power Effect/Break Even: 411.80
Max Profit: 8.20 ($820)
ROC at Max: 1.99%
ROC at 50% Max: 1.00%
Will generally look to take profit at 50% max on the entire setup (stock + short call) as a unit, but won't hesitate to roll out the short call if in profit to keep my break even at or near where the underlying is currently trading.
Qqq idea Small channel using the renko charts , small channel inside bigger channel long term channel on red and short on white . I think the markets starts to retrace next week just a temporary pullback . Then maybe after elections the market will decide if it goes to bottom of big channel at 360 or keep rallying to 560. Right now seems to me top tech stocks are a little overbought. I expect the small channel to be tested on support and bounce from there . This is not a financial advidse

QQQ Will Collapse! SELL!
My dear friends,
QQQ looks like it will make a good move, and here are the details:
The market is trading on 479.18 pivot level.
Bias - Bearish
Technical Indicators: Supper Trend generates a clear short signal while Pivot Point HL is currently determining the overall Bearish trend of the market.
Goal - 463.82
About Used Indicators:
Pivot points are a great way to identify areas of support and resistance, but they work best when combined with other kinds of technical analysis
———————————
WISH YOU ALL LUCK

QQQUp move calculated from 259.73
target to 503.48
Circle shape possible come back to angle 315 at 468.71
Finally to executive triangle to go to final point

QQQ: Short Trade with Entry/SL/TP
QQQ
- Classic bearish setup
- Our team expects bearish continuation
SUGGESTED TRADE:
Swing Trade
Short QQQ
Entry Point - 479.18
Stop Loss - 489.67
Take Profit - 457.67
Our Risk - 1%
Start protection of your profits from lower levels
❤️ Please, support our work with like & comment! ❤️

Qs above the lineMeasured move into new ATHs in anticipation of NVDA earnings next week - end of month. Above the midpoint of channel (month). Week view.

Same Same But Different ?We See 4 Years Of Grow With High PE / PS / PB / FWPE With High Interest Rate The Market Look Super Strong Like Cannot Be Beat .. NASDAQ:QQQ

Market Crash - QQQ TopQQQ rejected perfectly on a retest of its previous ascending channel from the rally over the last year. It has finally gone back for that retest after breaking well below in April. It's not a big rejection yet, but this is something bears can feel good about. I'm still confident in my prediction and today has reaffirmed that confidence honestly, but I still question the action on VX. IF QQQ breaks above here and breaks out further, I may get my face ripped off. We shall see.

Will NVDA Stock Split Send QQQ to ATH Today??Outlook - With APPL primed for a run to ATH and NVDA stock split I can
see a rally to the upside if levels hold. Obviously huge news this week so I will stick
to my levels and play whatever side my analysis supports.
Upside Targets:
* 463.41--464.16--465.7
Downside Targets:
* 462.32--461--459.17
Quantum Edge Analytics = T/A supports bullish momentum if 463.41 breaks and holds

Market Crash - QQQ Ascending WedgeHere we have yet another rising wedge, this time on QQQ. This pattern started back in October of 2023, so if we fall below, that's most likely going to be a substantial move. The longer the time period you have for a pattern, the bigger the move. An upside breakout is possible, if it breaks this wedge to the upside that'd be quite bullish. Easy to say it's bullish if it hits a new ATH, but when you have a bearish pattern that flips bullish, it usually adds even more movement. The best odds are for it to fall below.

QQQ still confined to the trading channel since 2010The blue trading channel has been a very reliable resistance since 2010. You can see the many times that it has confined price action, only being broken during the COVID bubble. My guess is that it will continue to be resistance. We will likely see a repeat of the action from 2015 and 2018 where price will slowly work sideways but ever so slightly higher with numerous pullbacks until we see a large pullback to the support side of the channel.
Here is what the action looks like on the 1D. You can really see the price trying to break out, but as we saw back in April, it ultimately lost and we had a nice pullback to buy into.

QQQ Scalping Zones 6/11Outlook - Thesis from yesterday almost played out but no support from APPL kept QQQ from reaching ATH.
With big news dropping tomorrow I would expect chop in a tight range 465-462
Upside Targets:
* 463.94--464.39--464.85--465
Downside Targets:
* 463.22--462.11--460.11
Quantum Edge Analytics = T/A supports bullish momentum if 463.25 breaks and holds.

QQQ 25.5% decline over 260 daysI believe that QQQ / NASDAQ has reached its peak and will be heading into a decline / recession starting sometime in July or as late as October.
The information and publications are not meant to be, and do not constitute, financial, investment, trading, or other types of advice or recommendations. I am not a financial expert, please do your own research and seek professional and licensed help for financial decisions.

$QQQ $NASDAQNASDAQ:QQQ #Nasdaq $480-$490 seems easy this year...
-Base Trend Holding & WR Formation
- BreakRetest & Weekly Engulfing on Weekly Resistance
-Could see 480/90s by 2025

QQQ Set To Fall! SELL!
My dear subscribers,
This is my opinion on the QQQ next move:
The instrument tests an important psychological level 462.97
Bias - Bearish
Technical Indicators: Supper Trend gives a precise Bearish signal, while Pivot Point HL predicts price changes and potential reversals in the market.
Target - 450.36
My Stop Loss - 470.53
About Used Indicators:
On the subsequent day, trading above the pivot point is thought to indicate ongoing bullish sentiment, while trading below the pivot point indicates bearish sentiment.
———————————
WISH YOU ALL LUCK

QQQ: Expecting Bearish Movement! Here is Why:
Balance of buyers and sellers on the QQQ pair, that is best felt when all the timeframes are analyzed properly is shifting in favor of the sellers, therefore is it only natural that we go short on the pair.
❤️ Please, support our work with like & comment! ❤️

Trade Like A Sniper - Episode 26 - QQQ - (8th June 2024)This video is part of a video series where I backtest a specific asset using the TradingView Replay function, and perform a top-down analysis using ICT's Concepts in order to frame ONE high-probability setup. I choose a random point of time to replay, and begin to work my way down the timeframes. Trading like a sniper is not about entries with no drawdown. It is about careful planning, discipline, and taking your shot at the right time in the best of conditions.
A couple of things to note:
- I cannot see news events.
- I cannot change timeframes without affecting my bias due to higher-timeframe candles revealing its entire range.
- I cannot go to a very low timeframe due to the limit in amount of replayed candlesticks
In this session I will be analyzing Investco QQQ Trust (QQQ), starting from the 4-Month chart.
If you want to learn more, check out my other videos on TradingView or on YT.
If you are interested in private coaching, feel free to get in touch via one of my socials.

QQQ Scalping Zones 6/7 Outlook
- NFP data came in hot. Watching downside but as always the market will somehow find a way to continue this rally. Very important to stick to levels and keep emotions out. Follow me on all socials where I provide scalping zones across multiple asset classes. -Quantum Edge Analytics
Upside Targets:
* 464.45--465--466
Downside Targets:
* 462.88--462.17--461.05
Daily Trend Tracker -
*QQQ+ *DXY- *VIX- *US10Y+

QQQ BEARISH BUTTERFLY DEVELOPPINGOn 1 h chart bearish butterfly is developing
must break up and close above 455.58
targets are 464.47 then to 470.29

QQQ DAILY CART UP MOVEMENTStarted at october 2022 at 254.26 end by August 2025 at 495.96
will go to last triangle in green color by Decembre 2024


Don't get greedyI only shorted at the open because price hit resistance at the line I called, stay above. But as I was always aiming for a mild bullish scenario and the fact that if it did go up and hit that line, my shorts would be losses, I sold around 10 sharp, 10:05
