QQQ Will Collapse! SELL!
My dear subscribers,
This is my opinion on the QQQ next move:
The instrument tests an important psychological level 458.03
Bias - Bearish
Technical Indicators: Supper Trend gives a precise Bearish signal, while Pivot Point HL predicts price changes and potential reversals in the market.
Target - 442.80
My Stop Loss - 467.33
About Used Indicators:
On the subsequent day, trading above the pivot point is thought to indicate ongoing bullish sentiment, while trading below the pivot point indicates bearish sentiment.
———————————
WISH YOU ALL LUCK
QQQ trade ideas

$QQQ Quick Market Crash from TOMORROW (or Fri) Till June 4th1. Everything fits perfectly into place from a Fibonacci POV.
2. Jamie Dimon (who likes to give passive bearish opinions) said today that he thinks Private Credit debt investments, like BCRED, Pimco Flex Cred, which are basically Privatized bonds, could become an ugly nightmare for grandma's or innocent investors, that are trying to get their money out and can't because of liquidation limits. Liqudation limits have been put on the Private REITS already (BRIET and Starwood Capitol REIT). But Private Credit Funds are made up of the same bullsh NYSE:T as in the movie "The BIG SHORT", those are collaterized debt obligations, that's right.
3. Interest rates, specifically the %-!) Year Treasury rates have SPIKED the last 2 days and mortgage rates will certainly follow suit, making home buying even harder. (again).
This will cause an already shaky real estate market, even shakier.
"SHAKE SHAKE SHAKE, Shake yo Booty"
4 This Bearish correction trend should start sharply with the initial drop ending at around Tues, June 4th, at approximately between 10am - 1pm.
5, In total, after a B wave up, we could see a bear market into Middle to End of July.
6.
a. My bearish trade will start with Credit Call Spreads, Aug 19th expiration, with the short calls at 0.25 Delta, the long calls will be around 0.10-0.05 delta.
b. Then I may take 1/2 of all that premium and start buying deep OTM puts with same expiration, and then just buy and sell those into July, but keeping the Credit Call spread in placed till 21 DTE, approx July 20th, when they should be near worthless.


QQQ Trade Ideas for the Week of 5/27/2024Some potential paths for QQQ early this week. I'm leaning bullish, but will be ready to capitalize on downside if it happens.

QQQ: Short Trading Opportunity
QQQ
- Classic bearish formation
- Our team expects pullback
SUGGESTED TRADE:
Swing Trade
Short QQQ
Entry - 458.03
Sl - 468.73
Tp - 438.87
Our Risk - 1%
Start protection of your profits from lower levels
❤️ Please, support our work with like & comment! ❤️

Resistance of QQQ broke on Weekly ChartI plan to trade call options because the qqq broke its resistance on the weekly chart. I will buy it when it rested or pull back for 1 red calendar with volume dry up

QQQ to 380 before Jan 2026?This is a big statement, but this could come true. Just an idea as I don't usually trade QQQ or hold anything for more than a year at the moment. lol. If we did really enter a 5 year bull market last month, then I do feel 380 could be a good price target for a low size position trade.
NFA - just a thought

Support And Resistance"Support level 1" refers to a point where a candlestick drops down to wait for the right moment to enter buying at the first upward trend direction.

QQQ LongLooks like 471ish for a final target in late June. I'm not calling a top, but the move into it looks probable based on structure. Hopefully a dip at some point and then one more consistent rally to 471

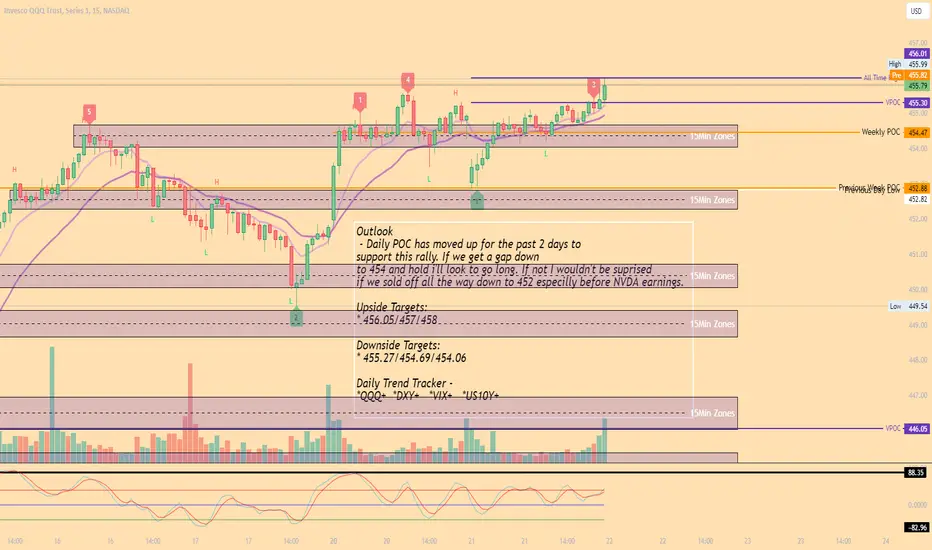
QQQ Scalping Zones 5/22Outlook
- Daily POC has moved up for the past 2 days to
support this rally. If we get a gap down
to 454 and hold i'll look to go long. If not I wouldn't be suprised
if we sold off all the way down to 452 especilly before NVDA earnings.
Upside Targets:
* 456.05/457/458
Downside Targets:
* 455.27/454.69/454.06
Daily Trend Tracker -
*QQQ+ *DXY+ *VIX+ *US10Y+

QQQ Nothing can stop itNASDAQ cannot be stopped, or can it ?
can we finally see a breath taking from US Markets or are we gonna continue all the way through higher highs until it blows up
China did the right move to sell 53bn US Debt cause if this thing suddenly stops, then they would be the one holding the sand bag

$QQQPrice swept liquidity and candle closed above key level. Waiting to see how price reacts to news. Overall looking to enter long

QQQ BULL FLAG | Possible New ATH'ssimple price action here, 4h macro structure broke to the upside with the 1h flagging at highs. Don't let it fool you though... this play could Boom OR Bust. Size accordingly.

QQQ Scalping Levels 5/20Outlook
- 452 is the key level to watch as it
was last weeks POC and the previous days high.
--If that level breaks and holds with
volume then I will wait for a pullback to go long.
---If not then obviously will be targeting my downside levels.
Upside Targets:
* 452.73/453.26/454.09
Downside Targets:
*4451.3450.7/450
Daily Trend Tracker -
*QQQ+ *DXY+ *VIX- *US10Y+

QQQ vs a formal FED liquidity model .... QQQ vs a formal FED liquidity model .... Adds :
Overnight Reverse Repurchase Agreements: Treasury Securities Sold by the Federal Reserve in the Temporary Open Market Operations, Assets: Other: Coin: Wednesday Level , Liabilities and Capital: Liabilities: Deposits with F.R. Banks, Other Than Reserve Balances

QQQ: Short Trading Opportunity
QQQ
- Classic bearish pattern
- Our team expects retracement
SUGGESTED TRADE:
Swing Trade
Sell QQQ
Entry - 451.77
Stop - 460.12
Take - 437.86
Our Risk - 1%
Start protection of your profits from lower levels
❤️ Please, support our work with like & comment! ❤️

QQQ Set To Fall! SELL!
My dear followers,
I analysed this chart on QQQ and concluded the following:
The market is trading on 451.77 pivot level.
Bias - Bearish
Technical Indicators: Both Super Trend & Pivot HL indicate a highly probable Bearish continuation.
Target - 440.08
Safe Stop Loss - 458.64
About Used Indicators:
A super-trend indicator is plotted on either above or below the closing price to signal a buy or sell. The indicator changes color, based on whether or not you should be buying. If the super-trend indicator moves below the closing price, the indicator turns green, and it signals an entry point or points to buy.
———————————
WISH YOU ALL LUCK

QQQ Double Top on Bearish DivergenceIf you haven`t bought the dip on QQQ:
Then it's important to understand that it's currently exhibiting a double top formation, known as one of the most bearish chart patterns, along with a substantial bearish divergence. I foresee a retracement soon, possibly to $416, but I still expect it to finish the year on a positive note!

QQQ Potential Paths Moving ForwardQQQ made a new ATH today and may close even higher. I think it will run up until it retests its ascending channel from earlier in the year.

$NASDAQ terminal upside phase SKILLING:US100 is reaching the extreme point in the market and levels indicated in the video are important

Resistance Support & RSIThe entry point for buying QQQ stock at the price indicated in the image can be followed, with both entry and profit-taking points provided.

QQQ 1hr - Stalling at Major ResistanceQQQ was looking great on Friday morning, it finally managed to break out above its bear flag and a downtrend it had been in since April. Unfortunately for bulls, it quickly rejected after consumer sentiment was released. Having a fakeout like this will usually lead to a larger move in the opposite direction, but I need to see more confirmation. I'll be looking for VX strength/weakness and will see if QQQ can gap back above these trendlines or if we're heading back down. We should get a bigger move by the end of the week and could have some great opportunities on retests, but I'm proceeding with caution until after CPI.
