$RDUS ( Bullish ) Long Term Setup Had this ticker in my watch list. Setup looks good to go long. Key resistance is support now.. lets see if it holds
RDUS trade ideas

RDUS Radius Recycling Options Ahead of EarningsIf you haven`t sold RDUS before the previous earnings:
Now analyzing the options chain and the chart patterns of RDUS Radius Recycling prior to the earnings report this week,
I would consider purchasing the 15usd strike price Puts with
an expiration date of 2024-11-15,
for a premium of approximately $2.02 .
If these options prove to be profitable prior to the earnings release, I would sell at least half of them.

RDUS Radius Recycling Options Ahead of EarningsAnalyzing the options chain and the chart patterns of RDUS Radius Recycling prior to the earnings report this week,
I would consider purchasing the 17.5usd strike price Puts with
an expiration date of 2024-9-20,
for a premium of approximately $1.15.
If these options prove to be profitable prior to the earnings release, I would sell at least half of them.

SCHN Schnitzer Steel Industries Options Ahead Of EarningsLooking at the SCHN Schnitzer Steel Industries options chain ahead of earnings , I would buy the $35 strike price Calls with
2023-4-21 expiration date for about
$0.27 premium.
If the options turn out to be profitable Before the earnings release, i would sell at least 50%.
Looking forward to read your opinion about it.

SCHN | Line DrawingInformation to have in mind:
I've graphed a few historic values that most analysts have in their notes.
Schnitzer Steel Industries Inc. reports their earnings 04/05/23 BMO: I'm anticipating the market will sell the surprise.
The %B is at a good value to "signal a continuation".

SCHN - Strong Breakout SCHN has broken out nicely of the down channel in white
It is now forming an up channel that i have drawn with the solid white lines
On an angle the structure could be viewed as an inverted head and shoulders
Breakout move should continue within this up channel, right shoulder forming.

$RDUS potential gap fill$RDUS has some tight price action under a key pivot, which if it breaks through could fill quite a large gap. This sector is strong and this stock is showing good relative strength along with signs of accumulation

Radius Health Announces AgreementRDUS: Radius Health Inc.
2022-06-23 09:15:00
Radius Health Announces Agreement to be Acquired by Gurnet Point Capital and Patient Square Capital

SCHN Possible TradeHello there,
After making a 20% up from this trade, we may make another 20% down.
Follow the chart for target and SL.
*** This is not a financial advice, I'm still a beginner trying to share my Road here.
Thank you.

SCHN Possible TradeHello Traders,
As you can see in the chart, SCHN is holding the uptrend and still bullish.
We will entre here with the green lines as a target.
THE SL will be 46.5$.
*** This is not a financial advice, I'm still a beginner trying to share my Road here.
Thank you.
Many thank to @Cape-Peninsula-Capital

Radius Announces Positive Phase 3 Topline Results for TYMLOS® (aRDUS: Radius Health Inc.
2021-10-18 08:30:00
Radius Announces Positive Phase 3 Topline Results for TYMLOS® (abaloparatide) Subcutaneous Injection in Males with Osteoporosis

$RDUS on watch...Been on my small cap watch list, missed entering so far. Going to keep an eye on this.

Schnitzer SteelThe stock reversed at a significant price level (recent distinct high, Fibonacci cluster and 70MA). The trade can be entered immediately (limit 51.50$) and the first price target is at around 59.50$. The stop should be placed at 44.55$ to maintain a decent risk/reward-ratio and the ATR stops daily chart can be used to manage the stop.

Schnitzer SteelChart pattern: Break out
Entry: Immediately
Stop: 55$
Target: 61.50$
Risk/Reward-Ratio: > 2:1
Stopmanagement: Parabolic SAR daily chart default settings
Description: The price broke out of a trading range and is testing the former resistance level which now acts as support. The high volume from the break out is also confirming the long scenario.

Schnitzer SteelChart pattern: Bull flag
Entry: Immediately (this would end the secondary downtrend of the correction)
Stop: 37.90$
Target: 57.50$
Stopmanagement: ATR Stops daily chart default settings
Risk:Reward-Ratio: 1.5:1
Description: The chart is forming a bull flag with a nice corrective pattern (which retraced under the 38 Fibonacci retracement). Target is the 1:1 Fibonacci extension of the former impuslive move.
Ordersize example: If you have a 10000K to trade and you only want to risk 1% of your volume, you can enter this trade with 600$.


BIG Potential for SCHNITZER STEEL Hello traders, SCHNITZER STEEL is in a bullish push with a hammer bull candle and a large buy volume made. In the TIMEFRAME 1 Min we see a buy line that tells us that we are staying in the current trend, with strong potential to break the VWAP. And breakout the stabilization zone to arrive in a next zone. Two important levels to pass after target is the top of the stabilization zone, which is the top of the December 2019 collapse candle.
Please LIKE & FOLLOW, thank you!


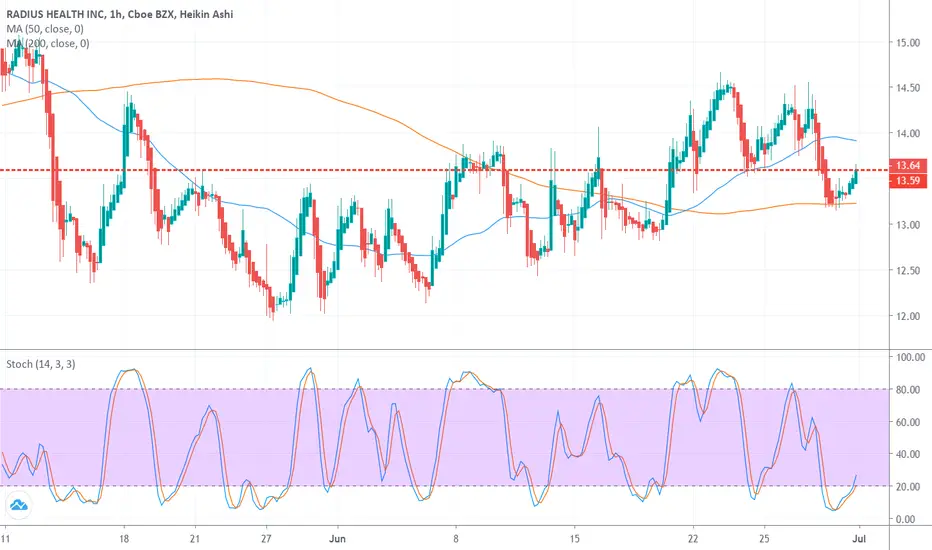
RDUS Stochastic Oscillator left the overbought zone on June 29Tickeron AI shows that this is a signal that RDUS's price trend could be reversing, and it may be an opportunity to sell the stock or take a defensive position. Tickeron A.I.dvisor identified 62 similar cases where RDUS's stochastic oscillator exited the overbought zone, and 56 of them led to successful outcomes. Odds of Success: 90%.
The price moved below its 50-day Moving Average, which indicates a reversal from an Uptrend to a Downtrend. In 42 of 52 cases where RDUS's price crossed below its 50-day Moving Average, its price fell further within the subsequent month. The odds of a continued Downtrend are 81%.
RADIUS is ready for an upward rally after being beaten downRADIUS is one of my most promising stock at the moment.
-From a micro-technical point of view, we see signs of trend reversal.
Two morning stars and two head & shoulders patterns (switch time frames) recently.
-From a macro-technical and fundamental perspective, there are several reasons that augment the reversal probability:
RADIUS was beaten down (too much).
It is lower than months and even years ago while, at the same time, having stronger fundamentals.
Radius is still in the innovation race as it entered in the Phase III of a new osteoporosis treatment (and IMO it is pretty incredible that the stock didn't move the day it was announced!)
Source: www.globenewswire.com
-From an even more macro perspective, the stock should be fueled by investors that bet on stocks that provide products that will be more demanded by an ageing population (osteoporosis).

RDUS BUY SOONBuy zone 1: 20.50~
Buy zone 2: 18.00~
A Pharma company so higher risk
Does have decent fundamentals, currently 3 drugs that are in phase 3 of testing and awaiting FDA testing
