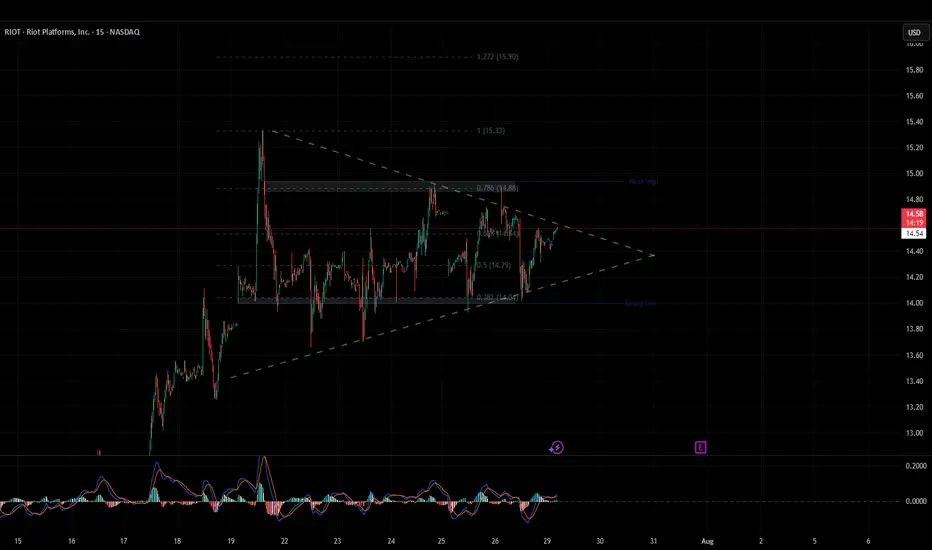
RIOT breakout soon?Looking at the TA, there’s a wedge forming over the past few days – not the cleanest setup, so mind your risk. But take a look at the option flow: I’m clearly not the only one eyeing this move. A few whales have been scooping up calls, sizeably above the usual flow.
media.discordapp.net
media.dis
Key facts today
Next report date
—
Report period
—
EPS estimate
—
Revenue estimate
—
−1.36 USD
109.40 M USD
376.66 M USD
330.51 M
About Riot Platforms, Inc.
Sector
Industry
CEO
Jason Les
Website
Headquarters
Castle Rock
Founded
2000
FIGI
BBG000BQ4512
Riot Platforms, Inc. is a bitcoin mining company, which engages in the provision of special cryptocurrency mining computers. It invests in Verady, Coinsquare, and Tess. It operates through the Bitcoin Mining and Engineering segments. The Bitcoin Mining segment focuses on maximizing ability to successfully mine Bitcoin by growing hash rate. The Engineering segment designs and manufactures power distribution equipment and custom engineered electrical products that provides them the ability to vertically integrate many of the critical electrical components and engineering service. The company was founded on July 24, 2000 and is headquartered in Castle Rock, CO.
Related stocks
Why Riot Stock Dropped After Q2 Earnings Despite Good NumbersWhen I first saw Riot Platforms' Q2 2025 earnings report, the numbers looked impressive at first glance. The company posted net income of $219.5 million, a dramatic turnaround from recent quarters. But as I dug deeper into the details, it became clear why the stock sold off despite what appeared to
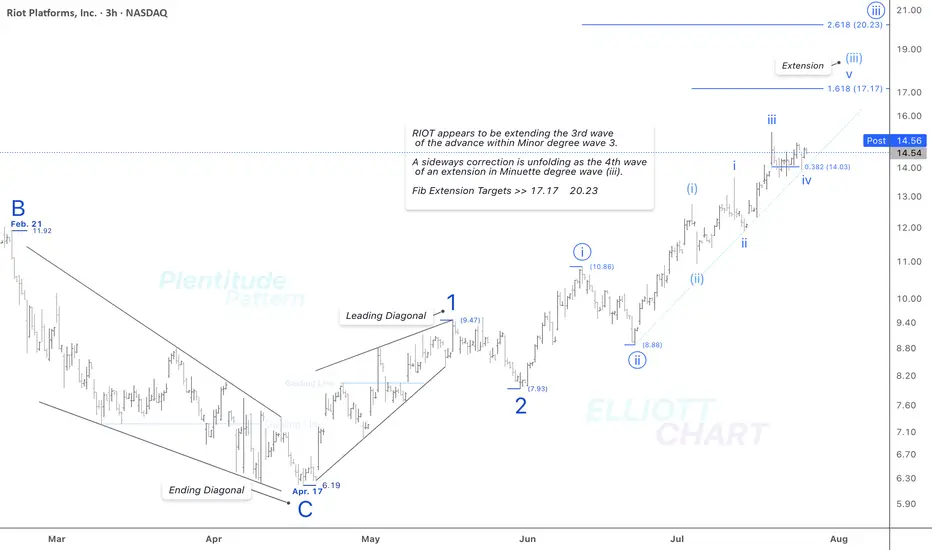
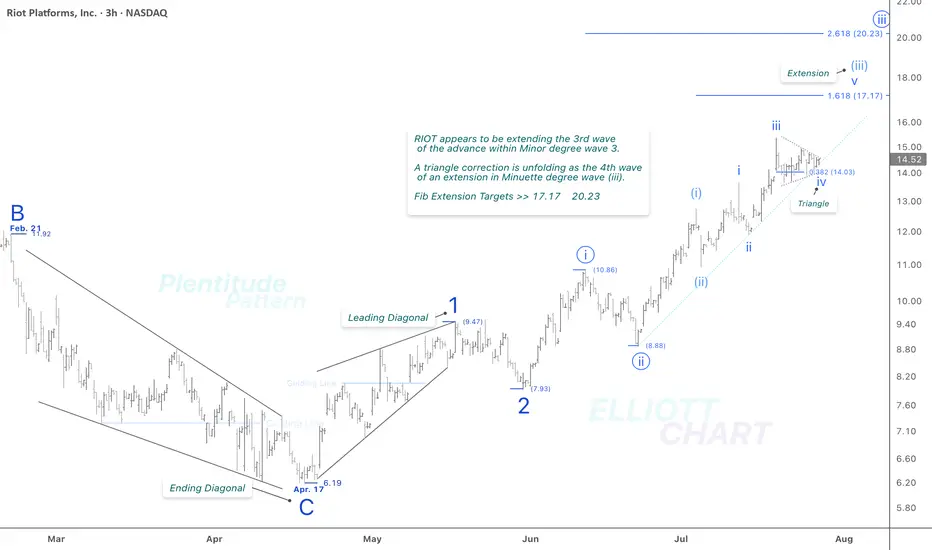
RIOT / 3hAs illustrated on the 3-hour chart above, NASDAQ:RIOT appears to be extending the third wave of an impulsive advance within Minor degree wave 3.
And as anticipated, a sideways correction is unfolding as the fourth wave of the ongoing extension in Minuette degree wave (iii).
Fib Extension Targets
RIOT: Sideways is goodRIOT has broken above a very important downward channel dating back July of 2023. It is imperative that RIOT stays above the channel. The sideways consolidation while BTC and the crypto market corrects is a pretty good sign. Next week might be more of the same, maybe a bit more down to gain the mome
RIOT / 3hThere is no specific change in NASDAQ:RIOT 's previous analysis. As depicted on the 3h frame above, it appears to be extending the third wave of an impulsive advance within Minor degree wave 3. As anticipated, a triangle correction has emerged as the fourth wave within the ongoing extension of the
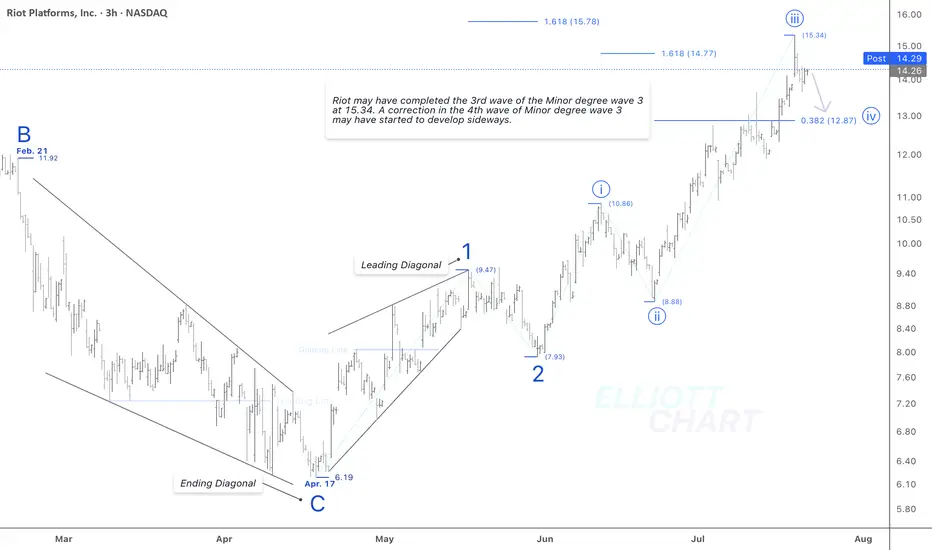
RIOT / 3hThere is no specific change in my NASDAQ:RIOT 's analysis. The wave iii(circled) of Minor degree wave 3 should have ended at 15.34.
Now, a following correction in the 4th wave of Minor degree wave 3 may have started to develop sideways. And it might take just a couple of weeks.
NASDAQ:RIOT CRY
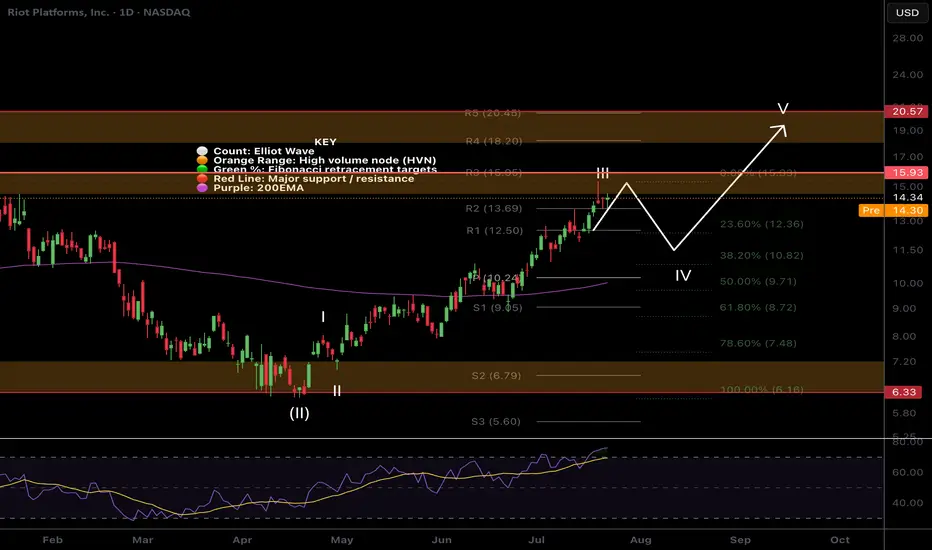
$RIOT Targets hitNASDAQ:RIOT has hit my take profit target at the High Volume Node and R3 daily pivot where it has found resistance.
Wave III appears to be complete with wave IV expected targets being the 0.382-0.5 Fibonacci retracement, also the daily pivot point and ascending daily 200EMA, $10.24.
Analysis is
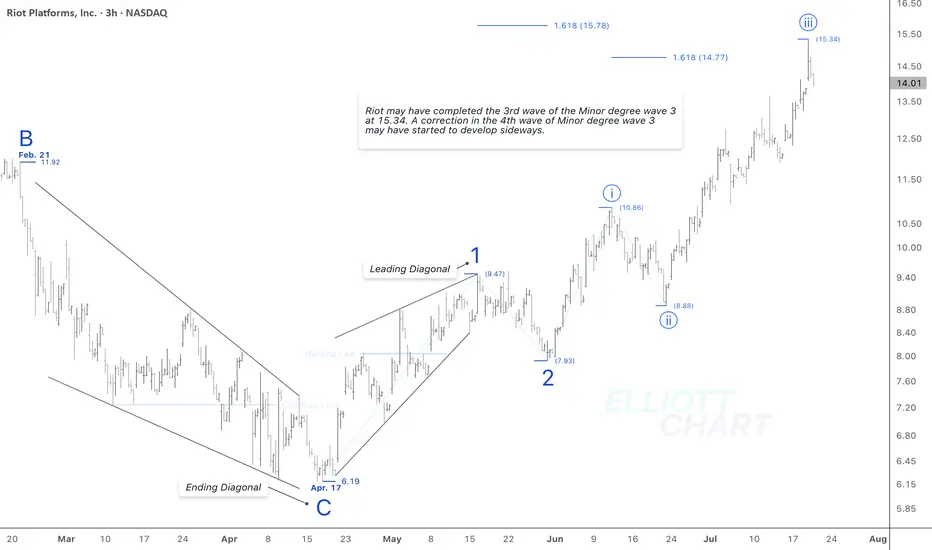
RIOT / 3hNASDAQ:RIOT may have completed the 3rd wave of Minor degree wave 3 at 15.34. Now, an expected correction in the 4th wave of Minor degree wave 3 may have started to develop sideways.
#CryptoStocks #RIOT #BTCMining #Bitcoin #BTC
NASDAQ:RIOT CRYPTOCAP:BTC MARKETSCOM:BITCOIN BITSTAMP:BTCUSD
RIOT LONGNIce breakout W/ Volume, following BTC momentum, Following with BTC momentum. $20 First Target.

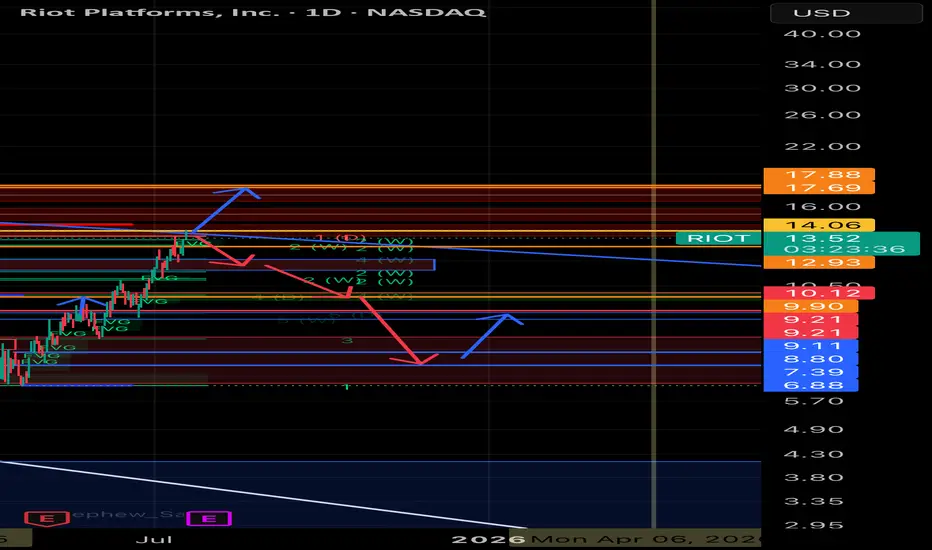
RIOT Platforms, Inc. ($RIOT) – Price Decision Point Near: $17 Br
📆 Timeframe: Daily (1D)
📈 Current Price: ~$13.56
🪙 Key Correlation: Moves in strong tandem with Bitcoin ( CRYPTOCAP:BTC )
⸻
🔧 Chart Analysis Summary
NASDAQ:RIOT has approached a major confluence zone just below $14.06, where several resistance levels, order blocks, and fair value gaps converg
See all ideas
Summarizing what the indicators are suggesting.
Neutral
SellBuy
Strong sellStrong buy
Strong sellSellNeutralBuyStrong buy
Neutral
SellBuy
Strong sellStrong buy
Strong sellSellNeutralBuyStrong buy
Neutral
SellBuy
Strong sellStrong buy
Strong sellSellNeutralBuyStrong buy
An aggregate view of professional's ratings.
Neutral
SellBuy
Strong sellStrong buy
Strong sellSellNeutralBuyStrong buy
Neutral
SellBuy
Strong sellStrong buy
Strong sellSellNeutralBuyStrong buy
Neutral
SellBuy
Strong sellStrong buy
Strong sellSellNeutralBuyStrong buy
Displays a symbol's price movements over previous years to identify recurring trends.
Curated watchlists where RIOT is featured.


Frequently Asked Questions
The current price of RIOT is 11.03 USD — it has decreased by −15.77% in the past 24 hours. Watch Riot Platforms, Inc. stock price performance more closely on the chart.
Depending on the exchange, the stock ticker may vary. For instance, on NASDAQ exchange Riot Platforms, Inc. stocks are traded under the ticker RIOT.
RIOT stock has fallen by −21.89% compared to the previous week, the month change is a −2.04% fall, over the last year Riot Platforms, Inc. has showed a 9.21% increase.
We've gathered analysts' opinions on Riot Platforms, Inc. future price: according to them, RIOT price has a max estimate of 25.00 USD and a min estimate of 15.00 USD. Watch RIOT chart and read a more detailed Riot Platforms, Inc. stock forecast: see what analysts think of Riot Platforms, Inc. and suggest that you do with its stocks.
RIOT reached its all-time high on Oct 29, 2007 with the price of 3,638.40 USD, and its all-time low was 0.51 USD and was reached on Mar 18, 2020. View more price dynamics on RIOT chart.
See other stocks reaching their highest and lowest prices.
See other stocks reaching their highest and lowest prices.
RIOT stock is 23.37% volatile and has beta coefficient of 2.49. Track Riot Platforms, Inc. stock price on the chart and check out the list of the most volatile stocks — is Riot Platforms, Inc. there?
Today Riot Platforms, Inc. has the market capitalization of 4.79 B, it has decreased by −0.16% over the last week.
Yes, you can track Riot Platforms, Inc. financials in yearly and quarterly reports right on TradingView.
Riot Platforms, Inc. is going to release the next earnings report on Nov 11, 2025. Keep track of upcoming events with our Earnings Calendar.
RIOT earnings for the last quarter are 0.57 USD per share, whereas the estimation was −0.18 USD resulting in a 425.56% surprise. The estimated earnings for the next quarter are 0.24 USD per share. See more details about Riot Platforms, Inc. earnings.
Riot Platforms, Inc. revenue for the last quarter amounts to 152.99 M USD, despite the estimated figure of 156.26 M USD. In the next quarter, revenue is expected to reach 170.21 M USD.
RIOT net income for the last quarter is 219.45 M USD, while the quarter before that showed −296.37 M USD of net income which accounts for 174.05% change. Track more Riot Platforms, Inc. financial stats to get the full picture.
No, RIOT doesn't pay any dividends to its shareholders. But don't worry, we've prepared a list of high-dividend stocks for you.
As of Aug 1, 2025, the company has 783 employees. See our rating of the largest employees — is Riot Platforms, Inc. on this list?
EBITDA measures a company's operating performance, its growth signifies an improvement in the efficiency of a company. Riot Platforms, Inc. EBITDA is −133.20 M USD, and current EBITDA margin is −40.62%. See more stats in Riot Platforms, Inc. financial statements.
Like other stocks, RIOT shares are traded on stock exchanges, e.g. Nasdaq, Nyse, Euronext, and the easiest way to buy them is through an online stock broker. To do this, you need to open an account and follow a broker's procedures, then start trading. You can trade Riot Platforms, Inc. stock right from TradingView charts — choose your broker and connect to your account.
Investing in stocks requires a comprehensive research: you should carefully study all the available data, e.g. company's financials, related news, and its technical analysis. So Riot Platforms, Inc. technincal analysis shows the sell today, and its 1 week rating is neutral. Since market conditions are prone to changes, it's worth looking a bit further into the future — according to the 1 month rating Riot Platforms, Inc. stock shows the neutral signal. See more of Riot Platforms, Inc. technicals for a more comprehensive analysis.
If you're still not sure, try looking for inspiration in our curated watchlists.
If you're still not sure, try looking for inspiration in our curated watchlists.