$RIOT - Breakout of resistanceRIOT broke out of resistance and is lagging behind MARA. Needs to break out of key pivot
RIOT trade ideas

RIOT--nearly 40% gains possibleBitcoin could hit ATH this week. A good week for bitcoin is a good week for mining companies. Loaded up on a few Friday, starting with Robinhood/Reddit fave RIOT. Eyeballed MARA as well but this one seemed to be not as bought up yet (while MARA is nearing ATH, but still probably a good play).
With RSI still under 50 on the daily, this ticker could be pushing 30s as soon as today.
This shit is just as volatile as crypto (obviously), so remember to bank some gains on the way up if we do indeed start to run up this week.

RIOT bbRIOT the video game company: 🚩🚩🚩
RIOT the bitcoin mining company: 👌👌👌📈📈📈
Entry + avg cost: $26.00
Take profit target: $52.00


$RIOT is looking good I entered a position in riot just with calls. I think that there could be a run up to$35 soon.

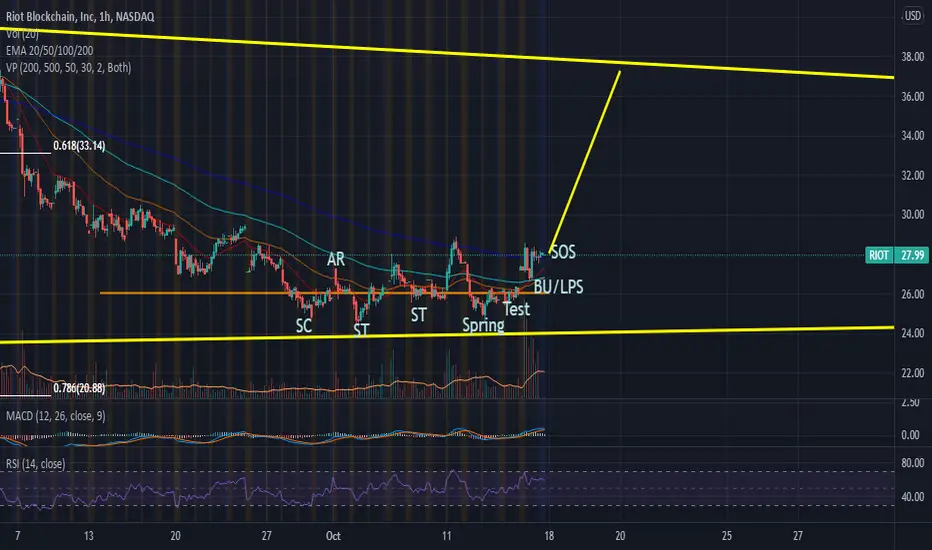
RIOT - Wyckoff Accumulation Complete - Signs of StrengthRiot has been lagging behind despite the massive pump on bitcoin.
Why? Well, most likely the price was being suppressed so big bags could accumulate more.
See the textbook Wyckoff accumulation pattern in the image.
You can see where the price was pushed down as it started to take off
Now we are at the signs of strength phase
I expect within a week or two to test the top edge of the wedge and most likely breakout to the upside along with new highs from bitcoin.
Inverted head and shoulders and huge breakout with 35% short intLargest North American Bitcoin miner that should be valued double ihas been held down by shorts. call activity says they are about to cover given the breakout.

double bottom pattern can play out here$RIOT creating a double bottom pattern similar to the one $MARA created a week or two ago, great risk reward at these levels in my opinion. entry 25.9, stop loss 23.5, price target 34/40.

Khan's Live-Charting 03 - $RIOTVery nice Wedge with easy Support, Resistance and Profit Areas. At the moment in a good spot to accumulate shares, with rising BTC-Price --> Nice swing opportunity

RIOT Fixed Range Of VolumeQuick follow up on my earlier post about RIOT Blockchain as part of my response to @Ahmedramzy81

$RIOTPO3 potential here. Invalidation and expansion marked. Couple this with my $BTC bullishness, and I think we could see $40 in the coming weeks/months.


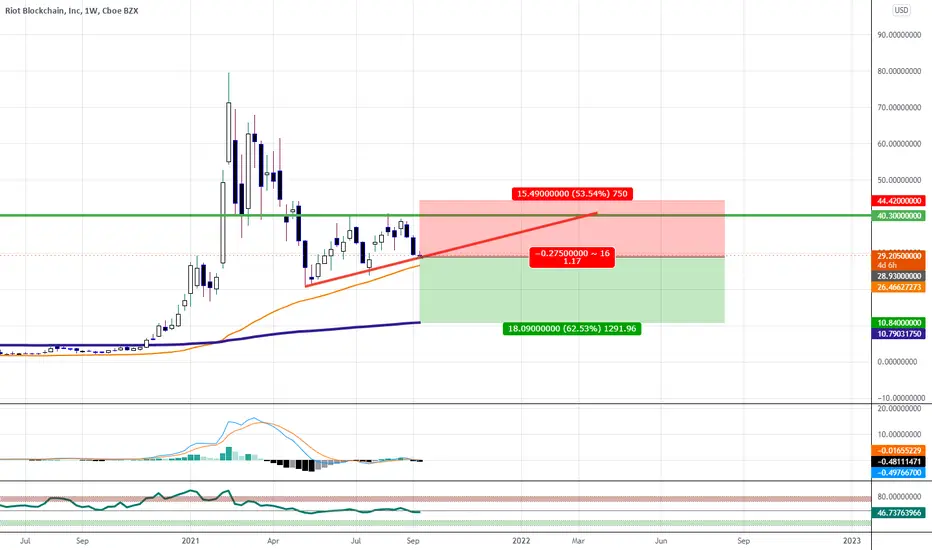
Riot Tripple bottomover the last 5-6 months, riot has been forming a big tripple bottom pattern, both on the daily charts as well as the weekly. On the weekly it is in a massive wedge as well.
If Bitcoins pushes over 50,000 dollars Riot is definitely a stock to watch

RIOT - YTD trendline broken todayThe simplest of trendlines and a classic example of breaking support.

RIOT broke its trendline from the beginning of the yearQuite simple. Make your own trendline from the lows of this year and see if the recent action violated it?

nice channel nice patterni just saw this. depending of tomorrows candle it is worth giving it a shot. 50% gain in 4 weeks. even it broke the MA 200 it still could be very bullish the next weeks. the fundamentals for this stock are exellent, idk why this shouldnt go back to 35.
Throw a like and leave a comment.
no financial advice, just for the lol

Perfect Bounce on Trendline for RIOTTrend line bounces don't get any cleaner than that. I believe RIOT is in a great place to make a breakout run if the market can hold itself together.
With the R:R being what it is, it's worth the risk to me.

RIOT :)has riot finally found its uptrend channel ??
its been in a deadly downtrend for the past little bit and after break out and consolidating has it found a channel. im thinking yes.

strategy for RIOT friday 09/17/2021strategy: today presents inside bar. If the opening is bullish, we would have a gap and go, we must wait for a good buy signal as follows, crossing both mv 200 5mn and 15mn, double top 30.40 plus the buy price 30.60. if we do well, we will take profits in the 31.80 area.
Our bearish entry: the action closed today near the minimum, this means intention of bearish continuity, if so, we will have a bearish gap and go. The opening must be with the break of the double bottom sell price 28.60. remember you must wait for the retest in 9mv or 10mv period

RIOT and Bitcorn.Riot in the Big Squeezy on the Hourly.
It may pop after a pull back and a HL accelerating into a HH.
Im looking for a pop above 33.65 for a run up to about.
Bitcorn on the move will pull this company up.
Namaste Traders.
RiotAs Btc is breaking the first key resiatnce of 48k. As long as it holds it as support, riot on the other hand has broken down from a potential bullish pattern we were tracking…. However. The support we have landed on has perfect confluence as a potential 3rd touch of uptrend support. This would show us 3 touches below on this uptrending support. Let’s gooo!


October and November OTM Put Options Looking Pretty Good HereI will be getting the monthly put options at strike 24 dollars from here in anticipation of a bearflag breakout as i think btc and riot will see the 200 week moving average again.