Can Rivian Survive the Perfect Storm of Challenges?Rivian Automotive reported mixed Q2 2025 results that underscore the electric vehicle startup's precarious position. While the company met revenue expectations with $1.3 billion in consolidated revenue, it significantly missed earnings forecasts with a loss per share of $0.97 versus the anticipated $0.66 loss - a 47% deviation. Most concerning, gross profit returned to negative territory at -$206 million after two consecutive positive quarters, highlighting persistent manufacturing inefficiencies and cost management challenges.
The company faces a confluence of external pressures that threaten its path to profitability. Geopolitically, China's dominance over rare earth elements - controlling 60% of production and 90% of processing capacity - creates supply chain vulnerabilities, while new Chinese export licensing rules complicate access to critical EV components. Domestically, the impending expiration of federal EV tax credits on September 30, 2025, combined with the effective end of CAFE fuel economy standards enforcement, eliminates key demand-side and supply-side incentives that have historically supported EV adoption.
Rivian's strategic response centers on three critical initiatives: the R2 model launch, the transformative Volkswagen partnership, and aggressive manufacturing scale-up. The R2 represents Rivian's pivot from niche, high-cost premium vehicles to mainstream, higher-volume products designed to achieve positive gross margins. The $5.8 billion Volkswagen joint venture provides essential capital and manufacturing expertise, while the Illinois plant expansion to 215,000 annual units by 2026 aims to deliver the economies of scale necessary for profitability.
Despite maintaining a strong cash position of $7.5 billion and securing the Volkswagen investment, Rivian's widened EBITDA loss guidance of $2.0-2.25 billion for 2025 and target of EBITDA breakeven by 2027 represent a high-stakes race against time and capital burn. The company's success hinges on flawless execution of the R2 launch, achieving planned production scale, and leveraging its software capabilities and patent portfolio in V2X/V2L technologies to diversify revenue streams beyond traditional vehicle sales in an increasingly challenging regulatory and competitive environment.
RIVN trade ideas
Bears Vs BullsThe bears have defeated the 50 EMA. Now can the bears defeat the support of the upward parallel channel or will the Bulls cycle price back up. Bulls need to move price Higher and stay away from the 11.56 area. Tomorrow the weekly candle finishes printing.

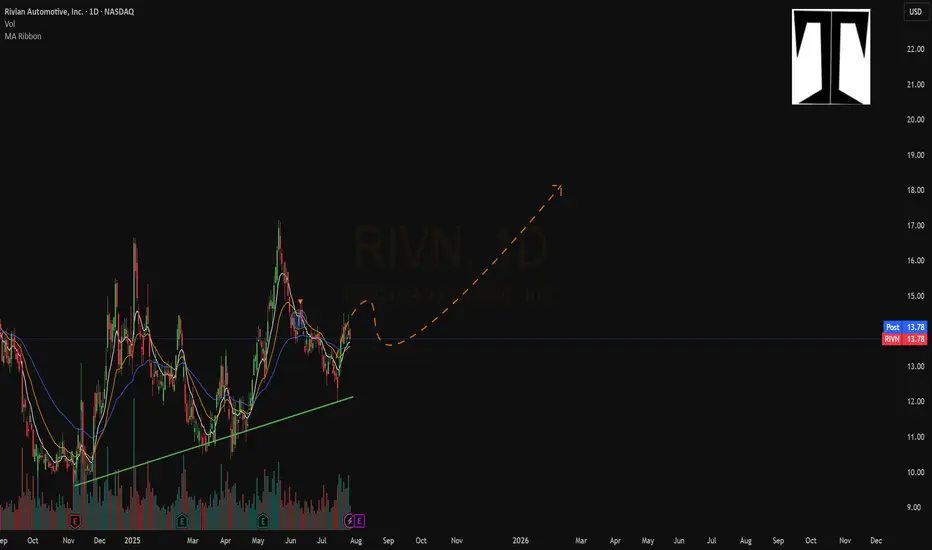
Rivian major consolidation coming to a decisionRivian is in my opinion coming closer to a decision on a breakout or breakdown. I personally love Rivian - I own one, and it's my favorite car I've ever owned. Next year they're planning on launching a much more affordable mid size SUV (R2) that I think will drastically increase their sales. It brings everything that is great about R1S/R1T to a more affordable platform without losing all the great technology and things we love about the more expensive R1.
I see that opportunity and want to be in on it, however as a trader, I need a deal and Rivian at $12 is not it. So I'm hoping this consolidation will break down for an opportunity at $7. There have been people holding this stock for so long betting on another Tesla, and with any luck some of them will finally throw in the towel if this obvious symmetrical triangle breaks down.
And if not, and it breaks up then I'm happy for all those loyal fans who've been holding for years. I love my SUV and am excited for Rivian to keep making even greater cars.
It's hard to predict how this pattern will play out, that's why I'm personally waiting on the sidelines.
Good luck!

Blue Boxes of ConsolidationIt seems the last two major moves on the chart (in the blue boxes) there was heavy consolidation for seven to 10 candlesticks, in this chart seven to ten weeks before a breakout. The bears now have a strong bearish candle but it is still in a consolidation pattern. The Bulls still have a trendline that held from April 2024 where price has not closed below it (please see SMA curve in black on the chart). If you turn on the 50 EMA price is still oscillating around it. And price is still in the Fibonacci golden zone. The bears need a bearish close with follow through below 12.40 and the bulls need a bullish close above 13.65 to hopefully kick off their party. The Bulls have a historical trendline and the Bears have a bearish MACD(Chris Moody) and a Braid filter that just flashed red and a recent strong bearish candle.

Quick View : RIVNDespite the bearish alert, I see some strenght here with the help of Earnings.
Bullish Crossover and box ready to be broken, and we are ready to catch it !
Heiken Ashi CandlesThis week Heiken Ashi candle gave a bullish close above the DOJI Heiken Ashi candle from last week. RSI is above 50. MACD (Chris Moody) look like it may have a bullish cross over soon. Stochastic RSI is getting ready to curl up. What do you think team? do you think the bulls maybe entering their season? Next few days are going to be interesting. If the buyers and investors can maintain the parallel structure the asset will go bullish however if it breaks it, the bears will celebrate. Keep your eyes on the Fibonacci levels, bulls want to see movement toward 14.54 and out of the Fibonacci golden zone.

RIVN Approaching Trend ShiftRIVN has NEVER held above the high time frame cloud....until now. Probably at least a 3-6 month idea, gotta give this time to play out after being down only since IPO. Green diag is current SL.

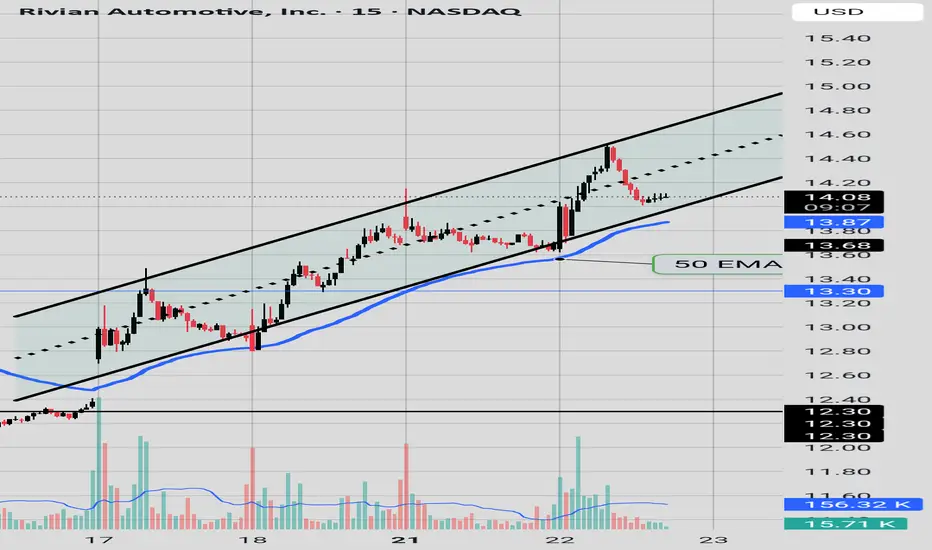
Pull back or ReversalPrice has fallen and is clinging to the 50 EMA (in blue) 13.97. Price is dancing outside the upward channel. If the 50 EMA does not hold price may fall to the 200 EMA 13.54 range in orange.

Bulls got the ballGreetings
Can the bulls maintain the upward parallel structure? Which also coincides with the 50 EMA. If so bulls can take price back up to 14.50 and possibly higher, but structure needs to be maintained.
RIVN: VCP patternRIVN: VCP pattern
.
Do you know how the VCP pattern is formed and how it works?
Let's see how the trend is formed and where it's heading.
.
US STOCKS- WALL STREET DREAM- LET'S THE MARKET SPEAK!
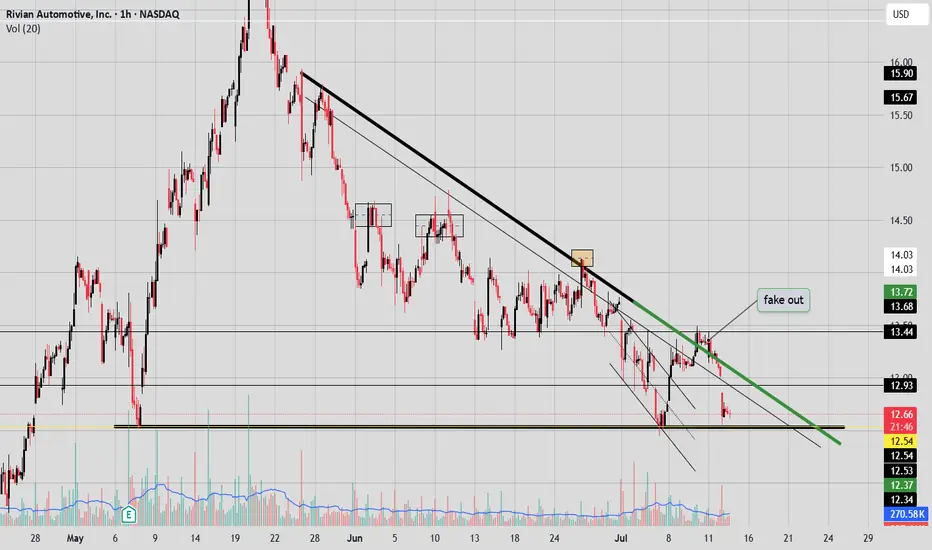
Alert for the Bears Hope for the BullsBears could not bring price below 12.54, bulls have kept the momentum. It seems price has broken out of the consolidaton. Bulls need more momentum and for more levels over 50 on RSI. Bulls need to make Higher Highs and Higher Lows from 13.70 with good RSI levels to keep victory going, if not then last candle victory would be for the bears delight a fake out.

Trendline and Fake outs Despite the previous fake out, the trendline on the hourly is still powerful displeasing the bulls but giving hope to the bears, the bears need price to go below 12.54 to complete the down trend on the hourly chart.
High Wave Candle on the weeklyWe have a High Wave Candle on the Weekly chart.
The candle is at the support of the upward parallel channel.
The candle is also under the 50 EMA.
The candle is at the vicinity of the 0.618 Fibonacci level.
Bears want to see the close of the next candle below 12.45, then the next price target at 11.82; bears ideally would like to see a complete break of structure to the downside and a candle close below 10.38 for a complete bearish takeover.
Bulls want the structure to maintain intact and a close above the Fibonacci Golden Zone 13.75.

3D TriangleThe ultimate indecision, we have asymmetrical triangle on a 3 Day Chart, however the downward movement in the price pattern may reverse due to the RSI pattern, but it seems bears and bulls will move with conviction once a breakout of the triangle happens.

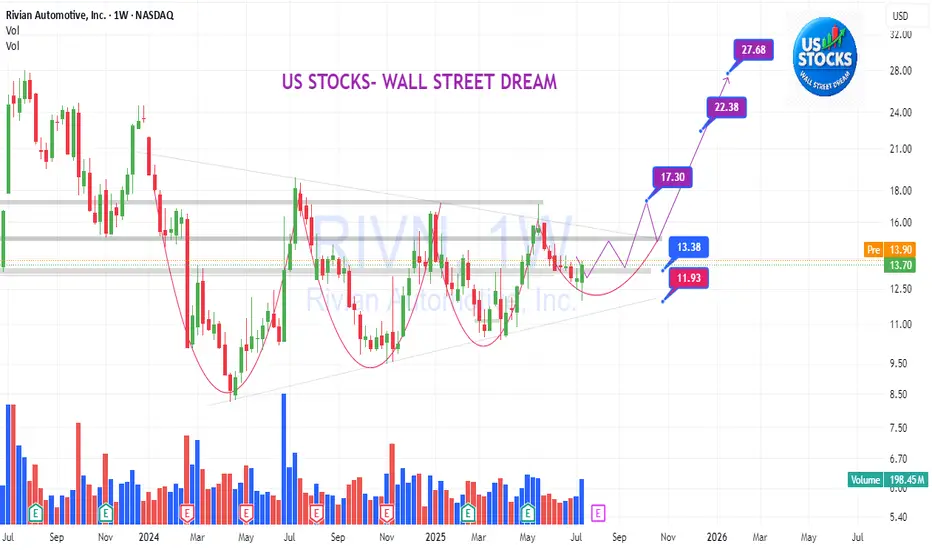
$RIVN - Long Setup BrewingRivian just broke out of a long-term downtrend and is now retesting that previous resistance as support. Price is coiling inside a falling wedge, sitting right above a key structure zone around $13. This area held strong in the past and could act as a launchpad if momentum steps in.
A breakout above the wedge could send it toward $17 in the short term, and if volume supports the move, there's potential for a much larger run toward $28. Watching for confirmation and strength on the retest — this setup looks like it's getting ready.
Not financial advice. Just sharing the chart.
#RIVN #SwingTrade #BreakoutSetup #TradingView #EVstocks

Breakout neededPrice is consolidating under the 50 EMA(13.22) and above the 10 EMA(13.10) at the resistance of a downward parallel channel. Can the bulls breakout, or will the bears maintain the downward parallel channel?

DemandThe asset is in an untouched demand zone that was formed around the first week of May. Will the bulls regain momentum and overcome 12.77 10 EMA? Or will the bears drag price down below 12.50 region? Also the 12.53 region on the day chart is a key level, so if it breaks below the bears have an upper hand and possible CHoC to the downside on daily.

Rivian seems bottomed outTrump proposes 25 % tariffs on all imported vehicles and parts, plus a tax deduction for interest on loans for U.S.-made cars.

Retest?Price is hovering below the 50 EMA now.
The candle that broke away from the consolidaton and fell under the 50 EMA, had alot of momentum and volume. But the most recent candle tried to reclaim the 50 EMA but fail by it's long upper shadow. The question is was the most recent candle a classical retest candle before the bears proceed to march on. Bulls need to maintain the 12.54 price or risk losing to the Bears.

Bears vs the Bulls the ongoing battleI know the Bulls are hoping this is a fake out and the Bears are hoping this is the beginning. Price has close slightly below the 50 EMA and MACD(Chris Moody) made a bearish cross and RSI dropped slightly lower. Bulls need price to reclaim the 50 EMA(blue curve) and have a bullish breakout out of the golden zone 13.83. Bears want a fully developed bearish MACD and lower RSI and price to move below the 50 EMA.

RIVN still on trackSame as prior charts, still like this one for long term personally.
Will we bounce before $11

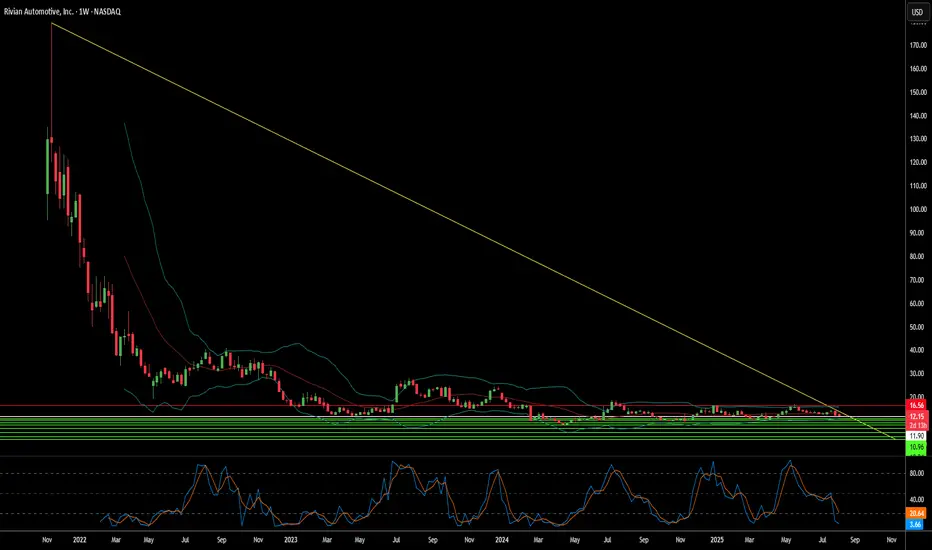
Bearish Breakout + Consolidation with Bullish BiasAfter a strong downtrend since 2022, Rivian (RIVN) broke out of its falling channel in late 2023 and has been forming an ascending channel since 2024. This structure suggests a potential medium-term trend reversal.
The price is currently around $13.60, sitting just above the 200-day moving average (MA200) and near a key support area of the ascending channel. This zone presents a potential technical entry point if the structure holds.
Technical Summary:
Higher highs and higher lows since early 2024
MA200 acting as dynamic support
Well-defined ascen
ding channel projecting higher levels
Trade Idea:
Suggested entry: $13.00 – $13.60
Stop loss: $11.90 (below the channel and MA200)
Take profit 1: $16.00
Take profit 2: $20.00
Take p
rofit 3 (extended): $24.00
If the price respects the channel and rebounds from this zone, we could see continued bullish movement toward $16 and potentially higher. If it breaks below $12.00 and loses the MA200, the bullish idea is invalidated.

Waiting RIVN is still resting at a major support level above the 50 EMA and in the Fibonacci golden zone. RSI is still above 50; momentum is still leaning bullish.Volume is drying up and is low, and the price hasn’t moved yet. We’re waiting for a breakout or breakdown. SAR indicator, alludes to just a minor pullback and that uptrend is still intact. The next move could possibly be the big one or not.
