RKLB: Critical point on Timeline Going to avoid getting into the fundamentals of this company, as I've covered them before (have been increasingly better with the contracts they've won).
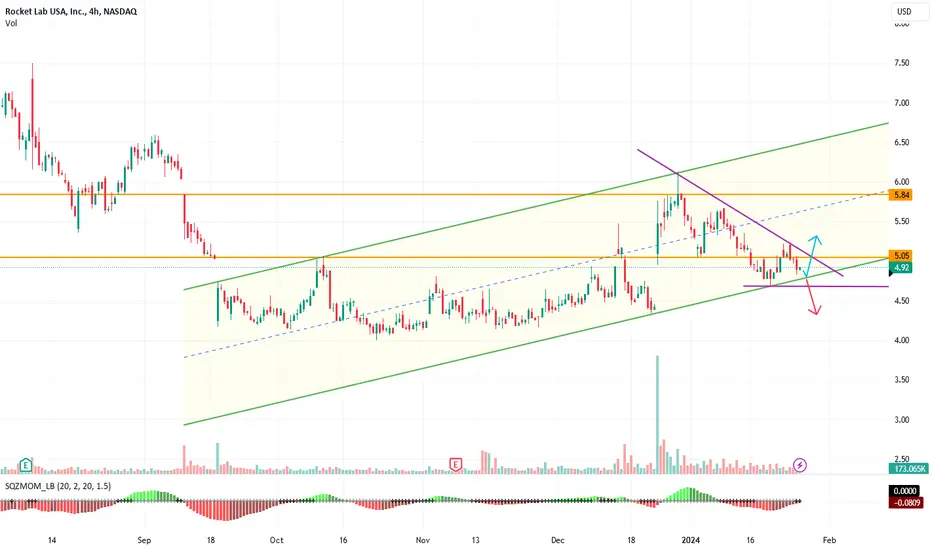
As we can see from this range price formed over the past 2 years, RKLB's 3-month downtrend could end through a reversal with great upside. It happened entering the final 70 days of last consolidation period, and I'm awaiting more confirmation for it to happen again in this period.
Keep in mind that price:
- Tapped the bottom of this demand zone (has never closed below)
- Broke below descending wedge (can reclaim before Friday)
- Is being hurt by S&P PA (last pump coincided with rising S&P)
I would be weary of longing any stocks at this point, but will be closely observing how RKLB closes Friday to inform the next steps.
RKLB trade ideas

Santa's Sleigh RunIn the frosty air of Christmas night,
Santa's sleigh takes its wondrous flight.
Through the twinkling stars, it soars,
Spreading joy from shores to shores.
Rocket Lab, a stock on the climb,
Six dollars, a goal in no time.
In the market's dance, a festive play,
A yuletide rise 'till Christmas day.

$RKLB looks promising for a breakoutNASDAQ:RKLB Looks promising for a breakout. Needs follow through. But it is a good start. Expecting $4.93 to $5.00.
FOMC meeting this week. This stock has adverse reaction to rate shocks and fed policy. So keep that in mind.

$RKLB - Showing signs of a turnNASDAQ:RKLB Rocket Lab is showing signs of a turn. MACD is about to do a bullish cross. RSI is turning up.
If it can break out of the descending wedge, it could run to the $4.93 to $5.00 area.
With high short interest, a positive catalyst could cause a big rally.
Share shorted -55 millions
Short Interest - 19.06%
Days to cover - 7 days
Keep in mind though there is a chance that it could see $3.17 to $2.88 area if the current support fails. It would need a negative shock for that to happen.

$RKLB - a series of unfortunate eventsNASDAQ:RKLB A series of unfortunate events!
Here is the chart where I plotted out a series of events that happened since September 2023. It shows the accumulation distribution and FINRA short sale volume.
1. You can see the stock has been in distribution mode since Peter sold 3.6 million shares. It is a small amount compared to what he owns, but it killed the momentum and completed the head and shoulder pattern. The full measured move for that head and shoulder pattern is $2.88!
2. The subsequent electron failure event further pressured the stock.
3. You can also see short activity increased even after winning a $515 million contract. You would think that shorts would cover. Instead, they piled onto the stock.
4. Since after the convertible notes offering, short activity has increased with the daily total volume.
It needs a catalyst to turn the sentiment around. It could be a successful Neutron engine hot-fire test or another big contract award.
As I posted in my prior post, if the current support fails, the stock could drop to $3.17 to $2.88 area.
Note: FINRA data doesn't include all short volume. So the actual volume could be higher.

Rocket Lab secures space force contracts, eyes satellite developRocket Lab USA, Inc. has recently been awarded two significant contracts by the US Space Force, underlining its capacity as a comprehensive provider of defence space services, including both payload development and launch capabilities.
The first contract, valued at 14.5 million USD, involves the launch of the DISKSat experimental satellite. The second, more substantial contract, worth 32 million USD, pertains to the design and launch of a satellite that enhances space security capabilities by approaching and potentially neutralising other space objects during threats.
Turning to the financial markets, here is an analysis of Rocket Lab USA, Inc. (NASDAQ: RKLB) stock based on the latest technical indicators:
On the Daily (D1) timeframe, Rocket Lab's shares have recently breached the support level at 3.75 USD, establishing a new resistance at 3.95 USD. Although the stock is currently on a downtrend, the rate of decline is moderating, as indicated by the tightening channel between the current support and resistance levels. Should the downtrend persist, the next target price may be around 3.57 USD.
Conversely, if the stock can overcome the 3.95 USD resistance level, a buying opportunity arises with a short-term price target of 4.70 USD. Looking ahead from a medium-term perspective, maintaining a long position up to the 5.65 USD level could be advantageous.
—
Ideas and other content presented on this page should not be considered as guidance for trading or an investment advice. RoboMarkets bears no responsibility for trading results based on trading opinions described in these analytical reviews.
The material presented and the information contained herein is for information purposes only and in no way should be considered as the provision of investment advice for the purposes of Investment Firms Law L. 87(I)/2017 of the Republic of Cyprus or any other form of personal advice or recommendation, which relates to certain types of transactions with certain types of financial instruments.
Risk Warning: CFDs are complex instruments and come with a high risk of losing money rapidly due to leverage. 66.02% of retail investor accounts lose money when trading CFDs with this provider. You should consider whether you understand how CFDs work and whether you can afford to take the high risk of losing your money.

$RKLB - What are the support areas if current support fails?NASDAQ:RKLB The stock spent last week sitting on the multi-year support zone. The longest Rocket Lab has traded around the support zone is 9 weeks.
If the current support fails, the next support area would be between $3.17 and $2.88. Could it fall to that area?
It is a possibility, given the current geopolitical climate, ongoing inflation and rate cut concerns, and uncertainty surrounding the neutron development timeline, these factors could put pressure on the stock.
Here are the support areas below:
$3.17
$2.88
$2.24

ROCKET LAB: Very strong long term buy opportunity.RKLB is almost oversold on the 1D timeframe (RSI = 31.788, MACD = -0.150, ADX = 26.851) which makes it an automatic technical buy for the long term. Besides that, the price has entered the long term Support Zone that commenced on the June 30th 2022 Low. The pattern is identical to the March-May 2023 bottom. Once the 1D MA50 breaks again, we expect a very aggressive rally. Target 1 on the LH trendline (TP1 = 5.50) and long term Target 2 near the HH and 1.236 Fib (TP2 = 8.75).
See how our prior idea has worked out:
## If you like our free content follow our profile to get more daily ideas. ##
## Comments and likes are greatly appreciated. ##

Rocket Lab - Double bottom or another inverse head and shouldersWaiting for Rocket Lab to break out of this channel to enter the trade. IMO, two possible scenarios:
1) This could play out as a double bottom with a take profit @ $6.
2) An inverse head and shoulders pattern in which we are currently complete with the formation of an inverse head. Neckline is at $5.
Caution to be exercised around the $5 area to determine which of these scenarios could play out.

RKLB to $10+Back to Demand Zone $3.70-$4.0
Just based on the current market cycle we're in small cap stocks like RKLB stand to benefit.
Needless to say that we also may witness Neutron, launching in 2025, which could be another major tailwind for the stock.
But for 2024- $11-$12

$RKLB - Feeling depressed?NASDAQ:RKLB Feeling depressed?
The good news is that what you are going through may be normal. 😂🙏🚀💰
Look at where we are in the market cycle.

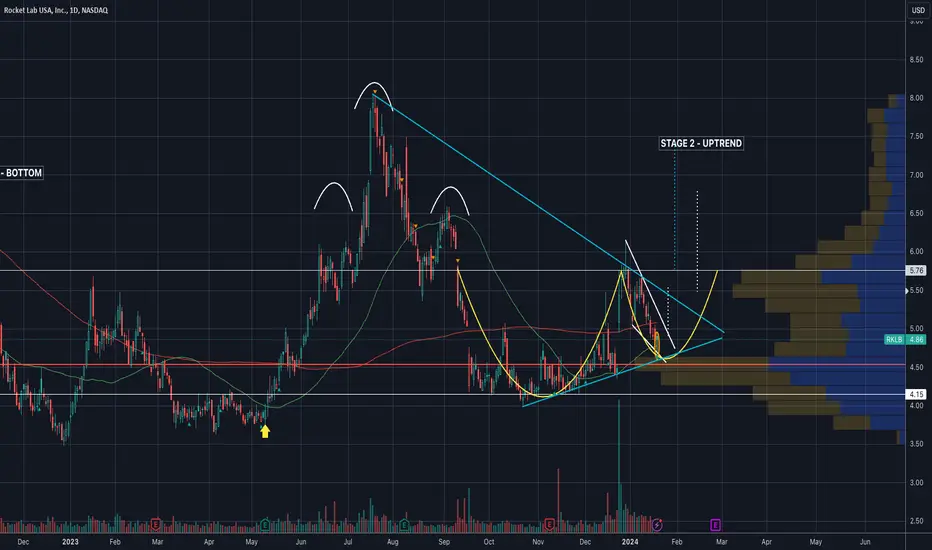
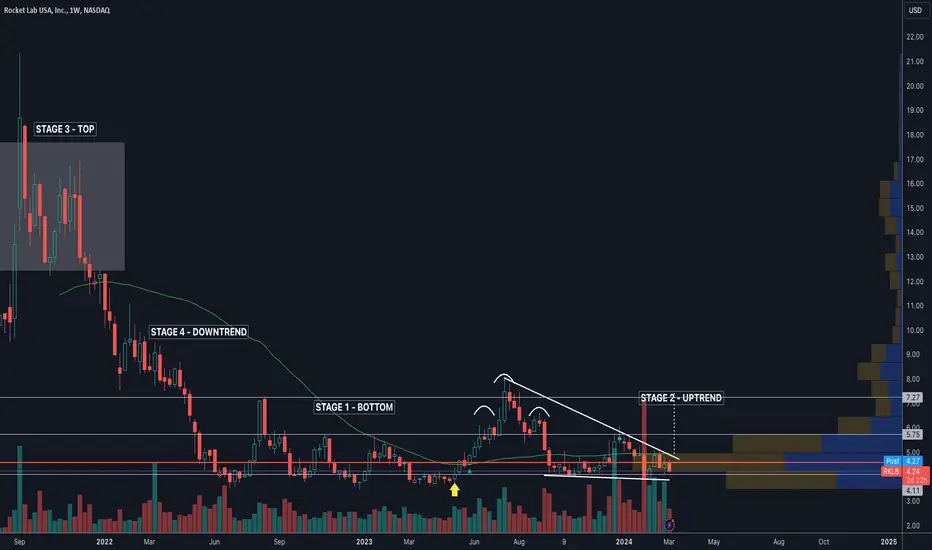
$RKLB - Still bottomingNASDAQ:RKLB If you zoom out, you can see that Rocket Lab is clearly trading inside the channel of a bottom stage. (Google Stage Analysis)
The base of the channel has formed a strong support after a long period of consolidation, as evident by the volume profile.
As you can see, the stock spends most of its time in the bottom half of the channel and bounces every time it touches it.
If it can break out of the descending wedge around $5.50, it can run to the $7.50 area.
My upside targets from the Feb 8 post remain unchanged.
$5
$5.50
$6
$7.50
Downside risk:
$3.80
ROCKET LAB on an accumulation zone, +100% profit potential.Rocket Lab (RKLB) just formed a Death Cross on the 1D time-frame, almost a full month after rebounding near the 1.5 year Support Zone. This is technically an Accumulation Zone that the stock tends to make on that Support Zone before starting a parabolic Rally to the Higher Highs trend-line.
In fact it was the 1D Death Cross formed on March 15 2023 that started the previous Accumulation Phase, which resulted into a +114.46% really. As a result, we expect this Phase to last until the end of March maximum, and then start a parabolic rally. Assuming each rally is by +10% stronger than the previous (1st +105.08%, 2nd 114.46%) then we estimate the next one to be around +125%. This will make a perfect test of the 8.75 April 21 2022 High.
Notice how each rally peak is very efficiently depicted by the tops of the Sine Waves. Also during each Accumulation Phase, the 1D RSI forms a Bullish Divergence on Higher Lows.
-------------------------------------------------------------------------------
** Please LIKE 👍, FOLLOW ✅, SHARE 🙌 and COMMENT ✍ if you enjoy this idea! Also share your ideas and charts in the comments section below! This is best way to keep it relevant, support us, keep the content here free and allow the idea to reach as many people as possible. **
-------------------------------------------------------------------------------
💸💸💸💸💸💸
👇 👇 👇 👇 👇 👇

Updated long term Idea RklbAn update on my long term movement idea with Rklb, it's just my theory after noticing the head and shoulders pattern on the daily and how things have been playing out with lower highs and lower lows to this point. I've listed on my chart what I think are some possible key areas of support and resistance. Again this is just my two cents on some next plays needing to play out before seeing some upward movement for bigger moves in the long run. I'd still anticipate some downward movement in the short term.

Rklb mid to long term movement idea for $8.05 rangePatiently waiting for a breakout to happen, if so I believe over the mid to long run, we should see things touch the $8.05 range, this is my price prediction.
www.tradingview.com

Climb the mountainPrice are defining a new channelup that probably will bring back to 5$ to the end of the month
Earnings on Feb 27 can change the plan pushing higher
I'm still bullish on Rocket Lab

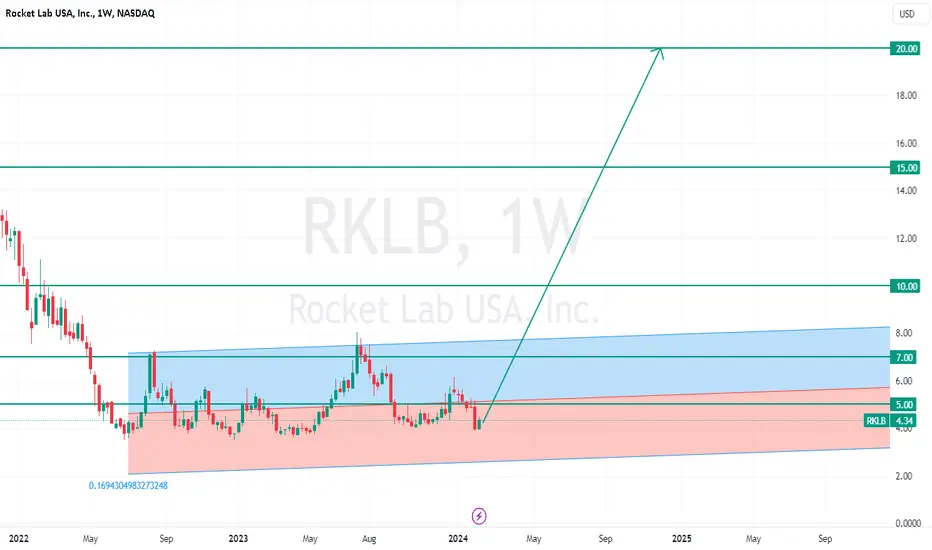
Rocket Lab USA - RKLB - Ready for upside movement Rocket Lab USA, INC RKLB CMP - $4.33 / Positional Trade
Buy Range $4.30 - $4.40 / Strict Stop Loss $3.45
Target 1 - $5
Target 2 - $7
Target 3 - $10
Target 4 - $15
Target 5 - $20
Disclaimer: This is my view and for educational purpose only.
$RKLB Potential OutlookSimilar to what it has done in the past, I believe it could create a very similar pattern. The one caveat is the M&A (Merger & Acquistion) news that is pending from their latest convertible note raise.

$RKLB - Can we launch?NASDAQ:RKLB Rocket Lab's prior setups were destroyed by the news of the convertible debt offering. We are now working with a new triangle setup.
The stock bounced from the lower trendline and is currently trading at the Point of Control (POC) volume resistance. The price needs to climb above $4.50 to clear the volume resistance.
Closing above $5.50 will validate the triangle breakout, potentially launching the stock higher to the $7.50 area.
The only things that can destroy this setup are a launch failure or Peter selling millions of shares again.
Upside targets:
$5
$5.50 (major resistance)
$6
$7.50
Downside risk:
$3.50

GroundedBad Bad news about private placement will hurt a lot
Triangle breaked downward and price will probably reach bottom of weekly chart today around 4.20$
I think price will then start to rise again quickly
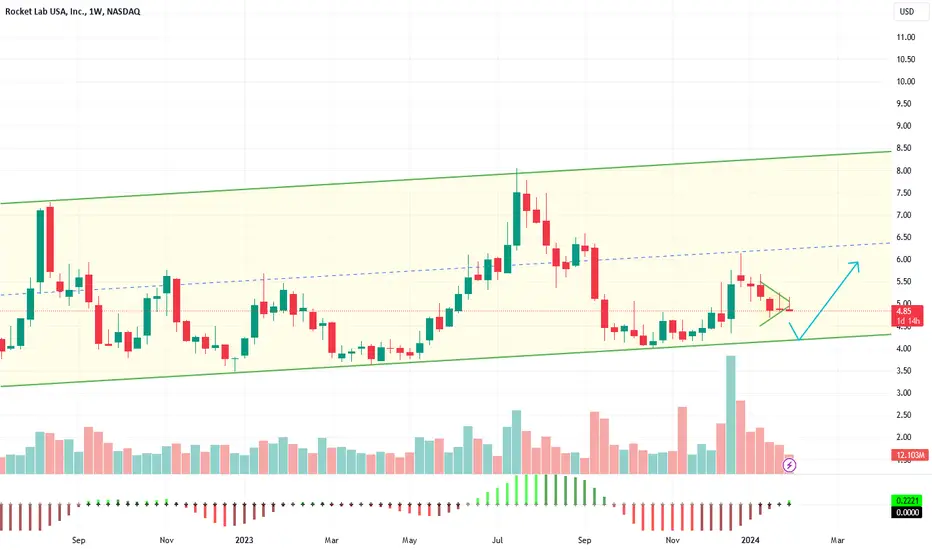
Symmetrical triangle compressionRocket Lab ready to explode
Price compressing inside a symmetrical triangle
I suppose a strong upside move will soon happen

Bounce incomingI think today price will bounce around 4,80$ to start a new upside movement
Closing over trendline at 5.06$ confirm bullish trend will continue
Closing below 4.68$ bullish trend will end
$RKLB - Can we see a turn?NASDAQ:RKLB Rocket Lab printed a hammer on Friday and closed above the 50DMA and a Fib, signaling a potential bottom.
In the near term, the stock is trading inside a descending wedge, and a breakout could send the stock to $5.50.
On the longer-term timeframe, the stock is trading inside a triangle with the cup and handle pattern, with a projected measured move of $7.50.
In a bearish scenario, I don't think the stock can go down below the $4.60 to $4.50 area, barring catastrophic events such as a launch failure, war, etc.
Upside targets:
$5.50
$6.80
$7.50
Downside risk:
$4.50
I post detailed technical analysis of stocks with targets. If you find my analysis helpful, follow me for more posts like this.