RUN Daily TriangleNASDAQ:RUN looks like it is about to break the bottom of the triangle and could be in big trouble. MACD just turned negative and the last 3 bars formed a pattern similar to an evening star.
Will short taking out the bottom of today's bar. Stop loss above yesterday's high.
RUN trade ideas


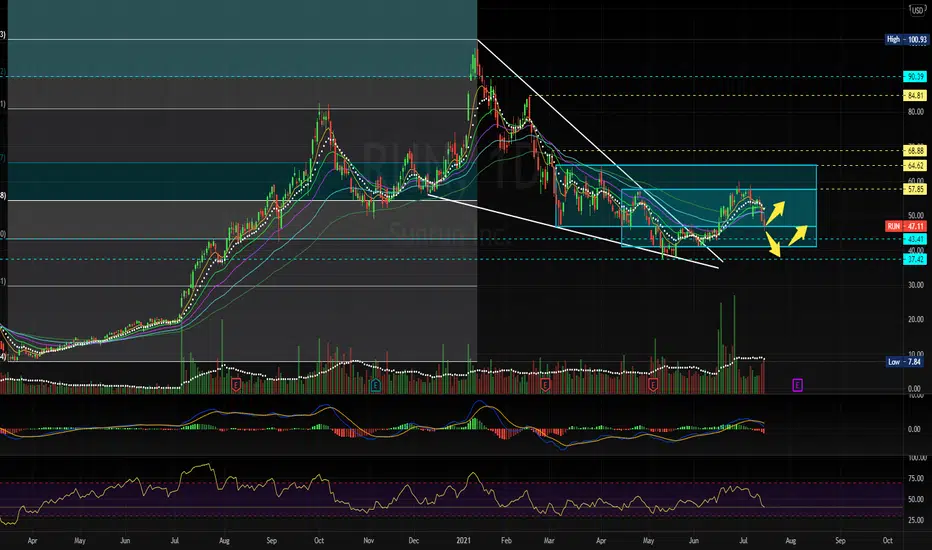
RUN at interesting zone as you know, we made a plant from 37 to 60 with this bullish WW few weeks ago, RUN came back to support now,
IF this support line hold, we can head higher from 43 to at least 57 for 30% but per the look; i wont be surprise to a fall down to 29$^or even 24$ which gonna be a good demand zone

$RUN Cypher w levels Lets see, possible harmonic in $RUN w 618% noted(often will bounce here on cypher) all details in chart, this is not off scan, just a powerful stock
last $RUN play that fizzled out after tp 1

Falling Wedge- BullishBig falling wedge on RUN that it's been holding for quite some time now. The solar sector tends to be cyclical with respect to price action, which in turn leads to big breakouts and vice versa (See charts of ICLN & TAN). With all of the intraday choppiness and the broader markets seemingly starting to pull back a bit as big tech takes a breather, the solar sector had surprisingly good relative strength on Friday with FSLR, NOVA, and RUN managing to close green on the day.
- Bollinger bands squeezing, closed Friday sitting right on its 20-day SMA (Not Pictured), and some slight bullish divergence on the RSI. Will be looking for a breakout from this falling wedge (broader market conditions permitting)- Just some support and resistance levels along with some RSI-based supply and demand zones to keep an eye on
PT1- $48.99
PT2- $50.27
PT3- $53.33+ Breakout
ICLN
TAN

Bullish- Long PlayFalling wedge as well as a possible inverse H&S forming (orange dotted line- neckline)- Watching this one closely as a sympathy play after ENPH's earnings

$RUN - Possible inverse Head & ShoulderPossible inverse head & shoulder forming. Right shoulder has yet to complete.
Break above neckline is bullish. Rejection from neckline is bearish.
Neckline - $58.81
Target 1 - $58
Target 2 - $68
Target 3 - $76
———————————————————
How to read my charts?
- Matching color trend lines shows the pattern. Sometimes a chart can have multiple patterns. Each pattern will have matching color trend lines.
- The yellow horizontal lines shows support and resistance areas.
- Fib lines also shows support and resistance areas.
- The dotted white lines shows price projection for breakout or breakdown target.
Disclaimer: Do your own DD. Not an investment advice.

RUN - Starting to Run?RUN = Starting to Run? Bounced off 61.8 fib support and showing upward trend? Will the upward move continue? Can it break through moving average resistance and get above $60? We will see?

good long setup here on RUN! I'm adding some RUN here with a tight stop. breaking downtrend channel + creating short term bottom? in my opinion we see a test of top trendline resistance in near future, PT 1,2 are my targets. good luck traders :)
$RUN update : retestingAs posted in last chart. RUN continues to be backtesting.
Two important trading zones here (two blue boxes)
levels are identified by the box edges.
Touch the SunRUN is looking bullish if it stands the support line and the fundamental boost on green energy is still to play in 2021. The last earnings report is also give it a good growth projection.


$RUN - PredictionHere is a prediction I made off the stock forming an inverse head and shoulders using past support and resistance level.

Run 64 test Accumulation has been there .
sentiment is low on this . not too overcrowded
bouncing off the 9 Ma atm ....
if market is in rip mode then this flies.
no 7/2 strike date , have to go with the 7/16
ended green today....


RUN - Daily Chart Feeling bullish on daily chart
Monthly resistance showed as RED line
Daily Resistance showed as Green Line
Swinging Trade
Trailing Stop loss is good deal!.
Thanks
Govind

$RUN Monthly Chart $RUN - Monthly Chart
--Its taking a swing, can go up to the resistance -1 . It can form a Head and Shoulder Pattern if it unable to break it.
--It needs to take higher high in monthly chart to form an uptrend
--Added Fibonacci extension
Thanks
Govind


RUN looks good on daily and weeklyIf goes out of resistance, this will go to $60
Stop: $50.25
If goes below $49, might fall to $45.70


$RUN. Go up!The upside targets are $69, $82.4, $98.
Today the paper broke out of the channel that it has been in since March.
It closed at the point where the 100-day came up to the 200-day and closed above the 51.6, which was the support level.
Also, the volume yesterday was the highest ever.
A pullback to the upper boundary of the channel is possible and then technically there should be a good move upwards.
It's my personal opinion and not investment recommendation.

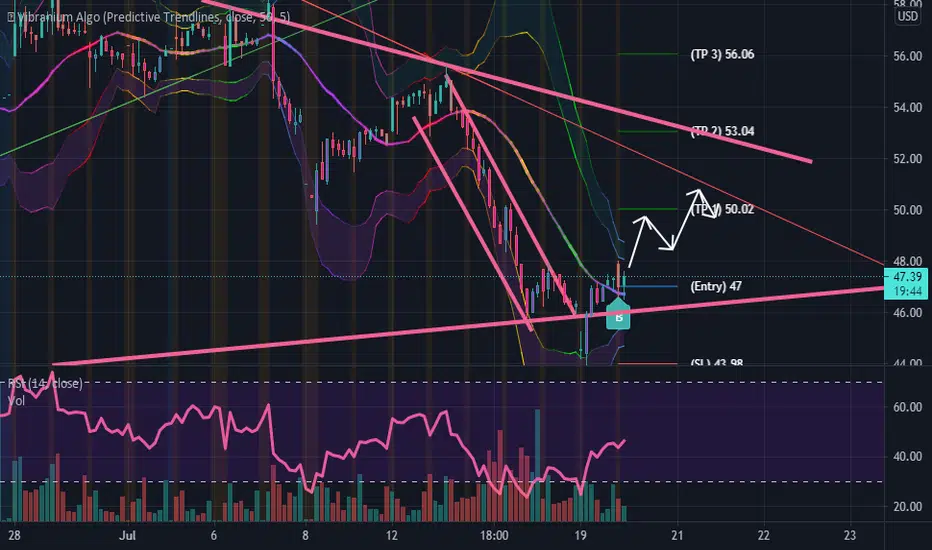
My View on SunrunRun is trading at $47.73, and huge volume coming.
My short term is,
- Option 1:
I enter the trade at the current price at $47.73 - $48.50, take profit at $56.20. If the price action is very bullish, I will "delete" the take profit and increase stop loss to $50.80. Then. take profit at the target 2.
- Option 2:
I might wait for the price pullback, and test the strong support zone at $46.70, i might enter around $47 to $47.50, and take profit at the target 2.
Comment your ideas please...
-----------------------------------------------------------------------
This is not financial advice. I'm not a Financial Advisor.
Trading is a high risk, do your own DD.
Let me know what you think
Cheers, I would share all my thought next time.
PEACE.
