SDGR – 30-Min Long Trade Setup!📈 🟢
🔹 Asset: Schrodinger, Inc. (SDGR – NASDAQ)
🔹 Chart Pattern: Symmetrical Triangle Breakout + Retest
🔹 Timeframe: 30-Minute
📊 Trade Plan – Long Position
✅ Entry Zone: $25.74 (Breakout from triangle + reclaim of yellow zone)
✅ Stop-Loss (SL): $24.50 (Below recent support + structure)
🎯 Take Profit Targets:
📌 TP1: $26.85 – Prior resistance & supply zone
📌 TP2: $28.30 – Major resistance near swing high
📐 Risk-Reward Calculation
🟥 Risk per share: $1.24
🟩 Reward to TP2: $2.56
📊 R/R Ratio: ~1 : 2.06 – Favorable setup with strong upside
🔍 Technical Highlights
✅ Tight triangle structure → breakout near apex
✅ Retest candle forming support at reclaim zone
✅ Clean trendline bounces with volume near breakout
✅ Higher lows = bullish momentum buildup
📉 Risk Management Strategy
🔁 Move SL to breakeven once TP1 is hit
💰 Lock partial profits at $26.85
🚀 Ride remainder toward $28.30 with trailing stop
🚨 Setup Invalidation If:
❌ Price closes under $24.50
❌ Fails to hold breakout zone after retest
❌ Weak volume or rejection under $26.50 resistance
SDGR trade ideas

SDGR Potential Buying Opportunity HereGood News for SDGR
"Schrodinger Highlights Discovery of SGR-1505, Clinical-Stage MALT1 Inhibitor, at American Chemical Society National Meeting"
Premarket : Testing the resistance
Once it clear 27 $, 10% upside potential .

SDGR - Bullish divergenceSDGR has been in an uptrend since breaking above its Base Formation neckline around $36.30, experienced several retracements of between 38.2% to 50% of each mini swings on the way up.
Its most recent retracement is more "severe", now at 61.8% retracement. And with Earnings expected just round the corner (on 2nd Aug), it appears there is some "fear" leading to earnings announcement.
Bullish divergence has begun to appear between price and RSI, hence it would be interesting to see if earnings would be the catalyst for the next rebound. NOT suggesting to take a position now (before earnings release) unless you are prepared for earnings risks.
Disclaimer: Just my 2 cents and not a trade advice. Kindly do your own due diligence and trade according to your own risk tolerance and don't forget that money management is important! Take care and Good Luck!


SDGRBullish Daily, Broke out of a falling broading wedge on the daily, price targets on the .618s over time. Additionally, there was a double bottom on the RSI, and a break and hold above the 200 moving average.

Roadmap for SDGRBlue solid lines are established downtrends, green dotted lines are established uptrends. Both the uptrend and downtrend lines are established from equilibrium points, (not highs and lows). Thickness of lines illustrates strength of previous price action. Circles are the crossing of uptrend and downtrend (Crossfire Points), usually resulting in reactions.

Schrödinger’s flatBut probably not for long
Breakout with bull div
Ai drug discovery via Billy G
What’s not to like?
Vax me bby
GRI 2023

W patternThis is not to entry short level.
Possibly a bearish Bat. This pattern can also extend to the 1.113 fib level.
No recommendation


SDGR UpdateAI drug discovery stonk
Early stage
Bill Gates
Apparently a lot of big pharma already use it
Seems to me a better play than vaccine stonks RN which is crowded
Looks bearish
Basically on final support else back to ground 0 (two horizontal lines)
NOT FINANCIAL ADVICE

$SDGR Possible PathLooking for a pattern repeat on the channel. Break of purple line would be confirmation

SDGR - buy it now or wait for it to break higher?As a trade, it's probably safer to wait for SDGR to break through $78 and 79, but I took a half position this week.
My conjecture is that the S1 pivot will provide stronger support, than the resistance to be faced at R1.
More importantly, I believe the broader market trend (bullish, with momentum) will help advance SDGR.
Looking for low to mid 80's target price but think it has more upside than that.
Bought shares not options on SDGR.
Note: YTD linear regression channel shows mean price of $67 currently. SDGR has been trying to move past +1 standard deviation bound since June 24th. Has been range bound since March 4 earnings release.


Short Term OpportunityThey have negative EPS and not acceptable growth and income (~100M$) for a 4.5B $ company, soon the earnings will arrive and my guess is that price will drop because some investors will not like the numbers.
But then the technical rational players will leave the arena and the irrational hype will start
Results can be found "improving" for some :) and then price will go up because people will be amazed about how complicated software they use in discovering new molecules for drug development and sh.t . and the next bull run will start. I cannot predict future of course but I will bet on it :)


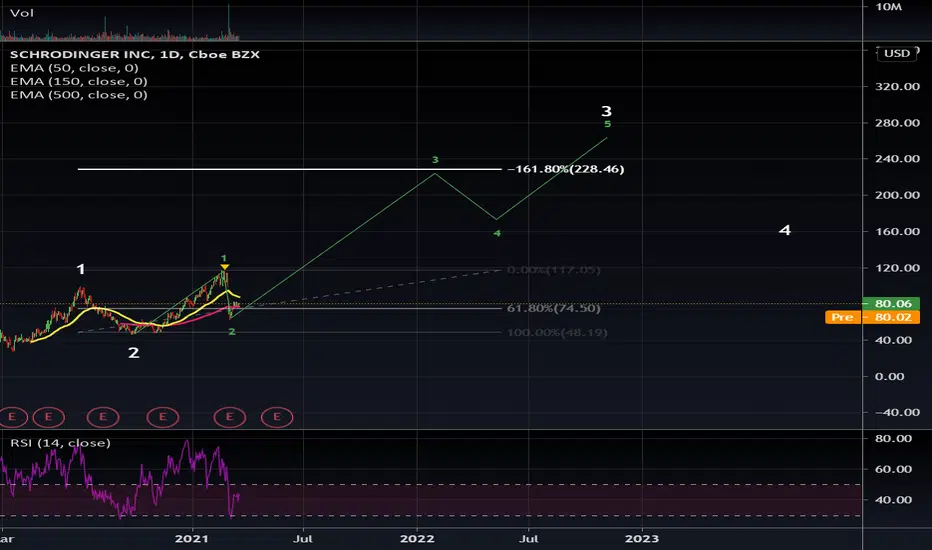
Wave countPossible end of this 1-2 1-2. Price is now at 0.618% with support of ema 150 on the daily tf.
If confirmed, target is $225 for this sub-wave 3
If you have these stocks in you portfolios, trim your positionsI believe this is a beginning of a new era not the end! Not even close to the end! These stocks just crossed below their 200 EMA, and made serious reversal patterns!
They will go down more with time!
Reevaluate your stop loss would save you a lot !


$SDGREntry price: 90.75
Fundamentals :
- Sector: Medical - Research
- EPS % Chg (Last Qtr): 128%
- EPS % Chg (Previous Qtr): 34%
- 3 Year EPS Growth Rate: 0%
- EPS Est % Chg (Current Yr): 0%
- Sales % Chg (Last Qtr): 29%
- Sales % Chg (Previous Qtr): 21%
- 3-Year Sales Growth Rate: 23%
- Annual Pre -Tax Margin: -30.4%

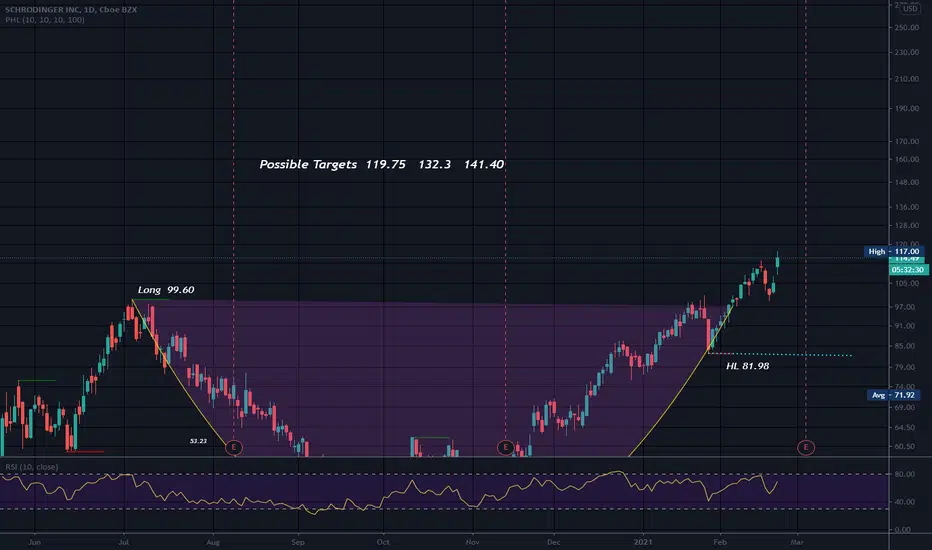
SDGR is in full swing with Cup & HandleTarget price for SDGR cup and handle is $140. Good way to go from here. I've picked up a decent amount. Wish I could grab more but still waiting for AAPL cup and handle to run up.

Cup and Handle Earnings 3-4. Large effective Volume on Friday.
No rising wedges noted in yearly chart. Up quite a bit today so perhaps wait for a good entry.
This gapped up at open and I am not sure why? Perhaps smart money trying to skip over resistance...not sure but it is now over the prior high.
Not a recommendation..
Schrödinger, Inc. provides computational platform to accelerate drug discovery and materials design for biopharmaceutical and industrial companies, academic institutions, and government laboratories worldwide. The company operates through two segments, Software and Drug Discovery. Its segment is focused on selling its software for drug discovery in the life sciences industry, as well as to customers in materials science industries. The Drug Discovery segment develops a pipeline of preclinical and clinical drug discovery programs through its computational platform in collaboration with pharmaceutical companies. Schrödinger, Inc. has strategic collaborations with Twist Bioscience Corporation; Thermo Fisher Scientific to extend the use of cryo-EM in connection within silico compound screening to accelerate drug discovery; and Bristol Myers Squibb Company to discover, develop, and commercialize therapeutics in multiple disease areas. The company was founded in 1990 and is based in New York.