SERV coiling nicely on daily with higher timeframe confluenceI really like how the daily, weekly, and monthly charts on SERV are lining up as the daily coils and tightens sideways within a constricting channel. I'm looking for a violent move on the break.
Support: 9.96
Resistance 12.40
Next report date
—
Report period
—
EPS estimate
—
Revenue estimate
—
−1.03 USD
−39.19 M USD
1.81 M USD
42.52 M
About Serve Robotics Inc.
Sector
Industry
CEO
Ali Kashani
Website
Headquarters
Redwood City
Founded
2017
FIGI
BBG0123N71Y3
Serve Robotics, Inc. engages in providing self-driving delivery. It designs, develops, and operates zero-emissions robots that serve people in public spaces, starting with food delivery. The company was founded by Ali Kashani, Dmitry Demeshchuk and MJ Burk Chun in 2017 and is headquartered in Redwood City, CA.
Related stocks

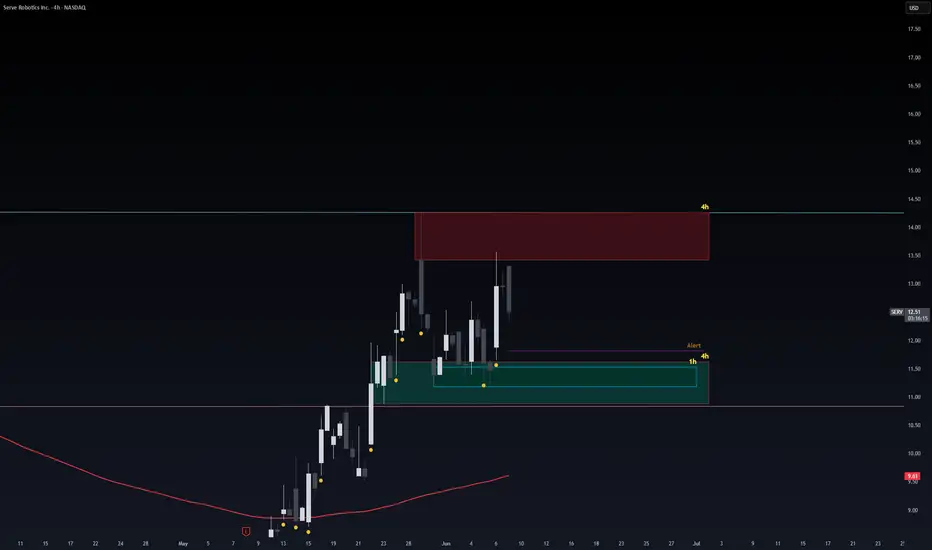
Safe Entry Zones SERVStock Movement Ranging.
Stock between strong resistance and support level of 4h zones both are significate selling and buying zones. in case breaking-down it will Down-Movement Stock and vice versa.
Note: 1- Potentional of Strong Buying Zone:
We have two scenarios must happen at The Mentioned Zon
SERV Breakout Trade Idea – 3.8x R:R Setup📢
🚨 Trade Setup Alert – Serve Robotics Inc. (NASDAQ: NASDAQ:SERV )
A clean ascending triangle is forming on the 30-min chart — price is squeezing toward the apex. A breakout above resistance could trigger a strong move.
📍 Entry: $12.65
🎯 Target: $14.46
🛑 Stop Loss: $12.18
📊 Risk-Reward Ratio: 3.

The pattern is true!This pattern is true, but only reflects a return to previously visited high just before the big drop. Primarily visits the initial area of imbalance for mitigation purposes. Price movement experienced after that mitigation is solely dependant on the frequency and location of imbalances created and m

Strong Buy ZoneThe Green 1h Zone Acts as Zone buying Zone.
The 1h Red Zone Acts as Resistance.
Scenarios Two: the 1h/4h Green Zone Act as the strongest support level.
Also there is strong Bullish Pattern "M pattern forming triple bottoms"
We have two Scenarios indicating Buyers step in Strongly Within 1h Gree

Clear Entry At Safe Buying ZoneNever Ever Follow stocks let it come.
Quantum Fans the Green 1h zone is safe entry zone.
We have two scenarios:
One: strong buying volume reversal Candle.
Two: Fake BreakOut of green Buying Zone.
Both indicate buyers stepping in strongly

Earnings soon, what will the movement be?All depends on movement prior to earnings, I drew my two different outlooks depending on if we rise prior to or decline prior to earnings.
With market tide shifting to bullish in the next month, I think we may pop to $12-$13.
Even if we drop after earnings, it will be a buying opportunity for the

loading SERV is in a special rectangle after price action hit a key level and now it is consolidating, please watch for movement outside of the structure please look at chart for key levels. Break out may be significant in either direction. Please be careful

Critical Point Here we have this asset at a critical point in the parallel structure, time will reveal if it falls out the channel to the Demand Zone or cycle up. Please see chart for key levels and parallel structure. Price must overcome the 11.83 to avoid the descent to a possible down trend.

Nvidia $SERV'd this one! Massive move still on the table!NASDAQ:SERV
NASDAQ:NVDA selling out of this one crushed this name but...
- The CupnHandle is still intact IF this is indeed bottom.
- Volume Shelf and S/R Zone here
- Right at smoothing line which has historically held pretty well.
Only time will tell but if we come back up and break out of t

See all ideas
Summarizing what the indicators are suggesting.
Neutral
SellBuy
Strong sellStrong buy
Strong sellSellNeutralBuyStrong buy
Neutral
SellBuy
Strong sellStrong buy
Strong sellSellNeutralBuyStrong buy
Neutral
SellBuy
Strong sellStrong buy
Strong sellSellNeutralBuyStrong buy
An aggregate view of professional's ratings.
Neutral
SellBuy
Strong sellStrong buy
Strong sellSellNeutralBuyStrong buy
Neutral
SellBuy
Strong sellStrong buy
Strong sellSellNeutralBuyStrong buy
Neutral
SellBuy
Strong sellStrong buy
Strong sellSellNeutralBuyStrong buy
Displays a symbol's price movements over previous years to identify recurring trends.
Frequently Asked Questions
The current price of SERV is 11.65 USD — it has increased by 2.19% in the past 24 hours. Watch Serve Robotics Inc. stock price performance more closely on the chart.
Depending on the exchange, the stock ticker may vary. For instance, on NASDAQ exchange Serve Robotics Inc. stocks are traded under the ticker SERV.
SERV stock has fallen by −5.28% compared to the previous week, the month change is a 3.10% rise, over the last year Serve Robotics Inc. has showed a 30.90% increase.
We've gathered analysts' opinions on Serve Robotics Inc. future price: according to them, SERV price has a max estimate of 23.00 USD and a min estimate of 10.00 USD. Watch SERV chart and read a more detailed Serve Robotics Inc. stock forecast: see what analysts think of Serve Robotics Inc. and suggest that you do with its stocks.
SERV reached its all-time high on Jan 6, 2025 with the price of 24.35 USD, and its all-time low was 1.77 USD and was reached on May 23, 2024. View more price dynamics on SERV chart.
See other stocks reaching their highest and lowest prices.
See other stocks reaching their highest and lowest prices.
SERV stock is 9.12% volatile and has beta coefficient of 1.63. Track Serve Robotics Inc. stock price on the chart and check out the list of the most volatile stocks — is Serve Robotics Inc. there?
Today Serve Robotics Inc. has the market capitalization of 665.49 M, it has increased by 11.11% over the last week.
Yes, you can track Serve Robotics Inc. financials in yearly and quarterly reports right on TradingView.
Serve Robotics Inc. is going to release the next earnings report on Aug 19, 2025. Keep track of upcoming events with our Earnings Calendar.
SERV earnings for the last quarter are −0.23 USD per share, whereas the estimation was −0.19 USD resulting in a −22.28% surprise. The estimated earnings for the next quarter are −0.20 USD per share. See more details about Serve Robotics Inc. earnings.
Serve Robotics Inc. revenue for the last quarter amounts to 440.46 K USD, despite the estimated figure of 420.18 K USD. In the next quarter, revenue is expected to reach 631.40 K USD.
SERV net income for the last quarter is −13.22 M USD, while the quarter before that showed −13.12 M USD of net income which accounts for −0.74% change. Track more Serve Robotics Inc. financial stats to get the full picture.
No, SERV doesn't pay any dividends to its shareholders. But don't worry, we've prepared a list of high-dividend stocks for you.
As of Jul 27, 2025, the company has 121 employees. See our rating of the largest employees — is Serve Robotics Inc. on this list?
EBITDA measures a company's operating performance, its growth signifies an improvement in the efficiency of a company. Serve Robotics Inc. EBITDA is −44.82 M USD, and current EBITDA margin is −2.10 K%. See more stats in Serve Robotics Inc. financial statements.
Like other stocks, SERV shares are traded on stock exchanges, e.g. Nasdaq, Nyse, Euronext, and the easiest way to buy them is through an online stock broker. To do this, you need to open an account and follow a broker's procedures, then start trading. You can trade Serve Robotics Inc. stock right from TradingView charts — choose your broker and connect to your account.
Investing in stocks requires a comprehensive research: you should carefully study all the available data, e.g. company's financials, related news, and its technical analysis. So Serve Robotics Inc. technincal analysis shows the strong buy rating today, and its 1 week rating is strong buy. Since market conditions are prone to changes, it's worth looking a bit further into the future — according to the 1 month rating Serve Robotics Inc. stock shows the strong buy signal. See more of Serve Robotics Inc. technicals for a more comprehensive analysis.
If you're still not sure, try looking for inspiration in our curated watchlists.
If you're still not sure, try looking for inspiration in our curated watchlists.