LENZ – Long Trade Setup !📈 🟢
Ticker: LENZ Therapeutics, Inc. (LENZ – NASDAQ)
Timeframe: 30-Min Chart
Pattern: Rising wedge breakout with volume push
💼 Trade Plan – Long Position
✅ Entry: $28.60 (breakout above consolidation + structure reclaim)
🛑 Stop-Loss: $27.26 (below wedge base and breakout level)
🎯 Take Profit Targets:
TP1: $30.52 – Key resistance zone
TP2: $32.52 – Extended range target / breakout continuation zone
⚖️ Risk-Reward Calculation
Risk per Share: $1.34
Reward to TP2: $3.92
R:R Ratio: ~1 : 2.9 — Strong long setup
🔍 Technical Highlights
Clean breakout of tight range wedge
Reclaim of horizontal resistance near $28
Rising trend with confirmation volume
Momentum from mid-April forming consistent higher lows
SEZL trade ideas

SEZL – Long Trade Setup!📈 🟢
Ticker: Sezzle Inc. (SEZL – NASDAQ)
Timeframe: 30-Min Chart
Pattern: Breakout from ascending triangle
💼 Trade Plan – Long Position
✅ Entry: $47.40 (confirmed breakout + momentum candle)
🛑 Stop-Loss: $45.00 (below breakout base and structure support)
🎯 Take Profit Targets:
TP1: $50.53 – Resistance from prior supply zone
TP2: $54.30 – Measured move breakout target
TP3: $56.00 – Extended profit zone
⚖️ Risk-Reward Calculation
Risk per Share: $2.40
Reward to TP2: $6.90
R:R Ratio: ~1 : 2.9 — Very favorable
🔍 Technical Highlights
Strong volume on breakout confirms strength
Ascending triangle is a classic bullish continuation pattern
Price closed above all key resistance levels
Healthy consolidation followed by breakout = momentum entry

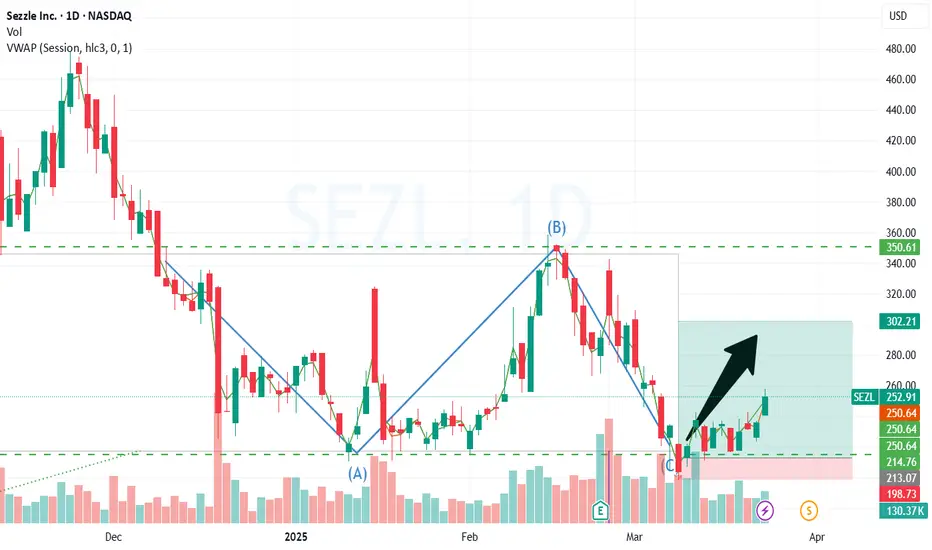
300 could be a major catalyst in the move ahead of split.With a few more sessions before the weekend, it couldn't be crystal clear as the tide awakes pre-split and a rush to a swing, not necessarily swing high, but swing either way. It hasn't disappointed me thus far. Did report bearish from 272-220; it went lower. Could this keep stretching? The TA, indicators, and sentiment seem to confirm this.
220 Looks likely based on the market conditionsWith bearish activity and a bearish movement highly anticipated, the stock could go as low as 220. Based on central positioning in many fundamentals (not oversold to maximum capacity). Also, the next few days could become more apparent toward a lower side based on wicks being filled and higher volume areas.

Tweezer top bottom to 280 and closing in on 300Many of the oscillators are hinting towards a move-up based on the controversy surrounding the ticker about the catalyst. Still, purely focusing on the TA, I see a few areas curving nicely, oversold levels, and a nice bottom here waiting on confirmation, but I do like this area for a bull run.

Market Update - 8/25/2024• market is in a nice uptrend after confirmation of rate cuts
• small caps are leading again finally
• short term we might be a bit extended, I'm a bit cautious on opening new large position sizes, looking to take profits
• keeping position sizes small at 5-10%

Market Update - 8/18/2024• lots of EPs this week on good economic data
• all indexes are above 50dma, suggesting an uptrend, improving breadth confirms this
• however, still skeptical about this, given that recession fears probably did not dissipate completely
• also looking for some potential short setups in case we continue to the downside
• not the greatest amount of 5 and 4 star setups either
• seems like in this environment, EPs probably work better
• downsizing my position sizes, focusing on perfecting my process until I become profitable


upward channeas expected we had correction after hitting $100 at the upper line of narrower channel...the lower ( support) line of the main channel held and we have positive upward movement today... although the upper ( resistance) line of narrower channel might hold again but also there is a chance this time we go to the upper line of the main channel , I hope we see more volume on the upward run ( IMHO do your own research plz)

still in same upward channelwe are still in same upward channel ... actually there are 1 narrower channel inside the main upward channel ... as long as we are in the main channel I think it makes sense to hold... its too risky to sell as you might be left behind...we might have small correction when hit the upper lines of the 2 channel but the correction might be small also there is a chance we break up the channel as well as now we are passing the previous high and normally the upward trend is accelerating when passing the historical high ( with assumption we don’t consider the ASX period otherwise the highest historical should be $250 ( AUD 380)...

still in bullish channel we are still in still in bullish channel , the excellent fundamental should support higher prices :)

upward channel we are in upward channel for a while, I belive worst scenario the lower line of the cahannel ( works as support line) will hold the SP ... if not we should see lower prices

Sezzle +50% Next target $56Chart is looking ready for next run
+ annual results
+ share but backs
+ 40% owned by CEO
+ value compared to other BNPL

$48 Target - Next stop before $500mil MCRetrace complete
Next run up
Target 48$
Fundamentals
Annual Update
A full-year profitable
Stock buyback
Asx delisting
New partnerships
New banking partner

$Sezl Sezzle - next move to $15.5 %30 profitShort term idea
Following FIBs
Next target 15.5
30% move

SZL - Technical and Fundamental seem very positive according to this possible Elliot Wave Analysis/ prediction , target could be in the sky ... I just wish individuals and institutes be aware of SZL and its potential , we need more volume...

Sexxle AustraliaSun Storm Investment Trading Desk & NexGen Wealth Management Service Present's: SSITD & NexGen Portfolio of the Week Series
Focus: Worldwide
By Sun Storm Investment Research & NexGen Wealth Management Service
A Profit & Solutions Strategy & Research
Trading | Investment | Stocks | ETF | Mutual Funds | Crypto | Bonds | Options | Dividend | Futures |
USA | Canada | UK | Germany | France | Italy | Rest of Europe | Mexico | India
Disclaimer: Sun Storm Investment and NexGen are not registered financial advisors, so please do your own research before trading & investing anything. This is information is for only research purposes not for actual trading & investing decision.
#debadipb #profitsolutions

Fundamental and Technical Long on $SZLSezzle Inc has a low market cap now of $500M due to recent sell off of BNPL sector.
Recently generating investment of $250M to expand USA/Canada and due for some press release which would easily see this stock shoot upwards.
Currently the downtrend / pain is firm, not sure if it will go as low as $2 but if it was time to bounce it is reaching last year's highs as an area of support.
Fundamentals: Strong relative to price
Technical: Far from 200MA
Starter position on this stock now.

Are bulls in control?Not very confident with today's 14.6% up move, are you?
definitely volume was good.
overall, BNPL sector doesn't look very attractive at the moment.
Monitoring it closely, I think it might go and touch $4.00 range.
Please note these are my own notes for my future reference, by no means a trading advise to anyone. Please do your own research before entryign into any trade.
Thanks!

SZL - Is it time to get Bullish?SZL may be giving another buying opportunity as it has bounced off for the 3rd time off its trendline. Currently it lacks momentum, but if price picks up or even consolidates at the current levels above the $6.30 zone, then we might see momentum picking up. For this scenario, the low must hold, and it could target the next Resistance level of $8.40 (potential 25% gain). Lets see how it develops in the next sessions.
Please note these are my own notes, by no means trading advice. Please do your own research before entering into any trade.

SZL back on radar with US IPO listing in the future.Chart is hard to read at the moment for a short term trade. Off news alone its a buy, but id rather a good entry so i can size in some leverage. Ill be watching how sezzle plays out next week as next resistance is at the 10-10.20 range, and the last 2 candles make the chart look extended. Ideally id like to see all of next week with sezzle in the price range of 9.50-10.20 before moving higher. Definetly on watch though as there is usually some good volatility for a day trade of it.
Entry here for a medium to long term investor here with a stop at 8.20. (Big stop loss, but the last 2 days have left some gaps, so it needs some strong consolidation)

SZL - Pullback about to end soon?The recent pullback has been strong but seems it may be about to end soon. I am expecting that it may be supported on the trendline to provide a good buying opportunity and the uptrend may resume. My Buy zone is $6.80 - $7.40 range, which is the trendline and the POC of Volume Profile, where I will be observing price action and wait for it to turn around, and aim for the recent highs.
Please note these are my own notes, by no means trading advice. Please do your own research before entering into any trade.

Potential breakout of sideways major trendWe're seeing growing support in the secondary trend with higher and higher troughs. This is looking positive to break out above the major trend resistance line.
