Stitch Fix (SFIX).Long Position
Entry: Above $4.80 (confirmation of breakout)
Target: $5.32, $5.70
Stop Loss: $4.20
Short Position
Entry: Below $3.03 (confirmation of breakdown)
Target: $2.50, $2.00
Stop Loss: $3.50
Bullish Scenario: If SFIX breaks above the $4.74 resistance, the next target would be $5.32. Given the momentum and current bullish indicators, a speculative target of $5.50-$5.70 by mid-August is plausible.
Bearish Scenario: Should SFIX fail to sustain above the $4.50 mark and break below $3.03, a bearish target of $2.50-$2.70 could be expected.
The latest candlestick patterns reveal a significant increase in trading volume, especially around mid-June, which resulted in a sharp upward movement in SFIX’s price. The price action shows a consolidation phase around the $4.50-$4.80 range, indicating accumulation.
SFIX trade ideas

6/4/24 - $sfix - uninvestable. gl to traders, too risky 4 me6/4/24 - vrockstar - NASDAQ:SFIX - guys look - all the clothing names/ shoe brands have been doing well this EPS season but i'd not include NASDAQ:SFIX in this bucket b/c not a brand owner and quite frankly - the trends suck per the google trends link below (which is proved by the financials). could there be a quarter here or there that bucks the trend optically and send this thing vertical w/ 14 days to cover (massively shorted)... sure. could this be the quarter? probably not, but always "possibly". i don't play those situations to the long side and the stock is so damaged that if it got punished 20% on a bad print i'd be forced to take the L and the wrong decision would be to double down (probably because it extends losses). even on the upside, we've see stocks that are bad charts get dumped fast by bag holders. i'd expect nothing different here. i'm not interested in looking at this one further unless there's some obvious fundamental change (and i'm open to it!) but for now this will bleed to zero w/ the fundamental profitability never hitting zero and "FCF" and decent balance sheet being the only redeeming factor. i don't play financialization games - i like secular winners - and this isn't one. sry to holders but i need to see the truth to make money. lmk if i've missed the boat.
-V
trends.google.com

SFIX Stitch Fix Options Ahead of EarningsIf you haven`t sold SFIX after the disappointing earrings:
or ahead of the previous earnings:
Then analyzing the options chain and the chart patterns of SFIX Stitch Fix prior to the earnings report this week,
I would consider purchasing the 4.50usd strike price Calls with
an expiration date of 2023-12-15,
for a premium of approximately $0.17.
If these options prove to be profitable prior to the earnings release, I would sell at least half of them.
Looking forward to read your opinion about it.

SFIX Stitch Fix Options Ahead of EarningsIf you haven`t sold SFIX here, after disappointing earnings:
Then analyzing the options chain and the chart patterns of SFIX Stitch Fix prior to the earnings report this week,
I would consider purchasing the 3.50usd strike price in the money Puts with
an expiration date of 2023-10-20,
for a premium of approximately $0.48.
If these options prove to be profitable prior to the earnings release, I would sell at least half of them.
Looking forward to read your opinion about it.

Stitch Fix, IncOn the above weekly chart price action has corrected 97% since the sell signal printed in February 2021. A number of reasons now exist to have a long position, including:
1) You know why..
2) Price action and RSI resistance breakouts.
3) Price action prints a double with higher lows in RSI.
4) Stochastic RSI prints hidden bullish divergence, fantastic.
5) No stock splits.
Is it possible price action falls further? Sure.
Is it probable? No.
Ww
Type: investment
Risk: <=6% of portfolio
Timeframe: Don’t know.
Return: Will say somewhere else
Stop loss: <= 2.40

SFIX disappointing Q2 earningsThe Head and Shoulders chart pattern is one of the most bearish signs that you can see in chart.
That was also the case with PTON:
i don`t know how they eventually turn out to corelate with fundamentals and be right.
Since it is still a growth stock, Stitch Fix needs to deliver strong momentum. Instead, Stitch Fix projected that net revenue will drop 10% to 7% YoY, ranging $485 - $500Mil below expectations of $560.5 million.
Full-year guidance is flat, possibly even a minor descent.
In this case, the Market Cap of 1.198B doesn`t justify.
We will see an all time low today.

long position on SFIXMy strategy is based on price action with the reading of certain indicators that I like while respecting all the values that define the stock maket

SFIX SFIX at 4.96 channel support and 200 MA ressitance break above 200 MA then 5.6 -->6.9-->7.6 .. average if down to 3.37

StitchFix Comparative PerformanceSFIX stock performance in comparison to:
1. Consumer Discretionary Index (XLY)
2. Gap + Nordstrom (general - clothing retailers)
3. Rent The Runway (key competitor)
Indicators to describe current overbought vs oversold conditions:
1. RSI = Relative Strength Index
2. MACD = Moving Average Convergence Divergence (direction change based on moving averages)
3. MFI = Money Flow Index (strength indicator based on directional performance and volume of stock traded)

Stitch Fix Inc USA Sun Storm Investment Trading Desk & NexGen Wealth Management Service Present's: SSITD & NexGen Portfolio of the Week Series
Focus: Worldwide
By Sun Storm Investment Research & NexGen Wealth Management Service
A Profit & Solutions Strategy & Research
Trading | Investment | Stocks | ETF | Mutual Funds | Crypto | Bonds | Options | Dividend | Futures |
USA | Canada | UK | Germany | France | Italy | Rest of Europe | Mexico | India
Disclaimer: Sun Storm Investment and NexGen are not registered financial advisors, so please do your own research before trading & investing anything. This is information is for only research purposes not for actual trading & investing decision.
#debadipb #profitsolutions

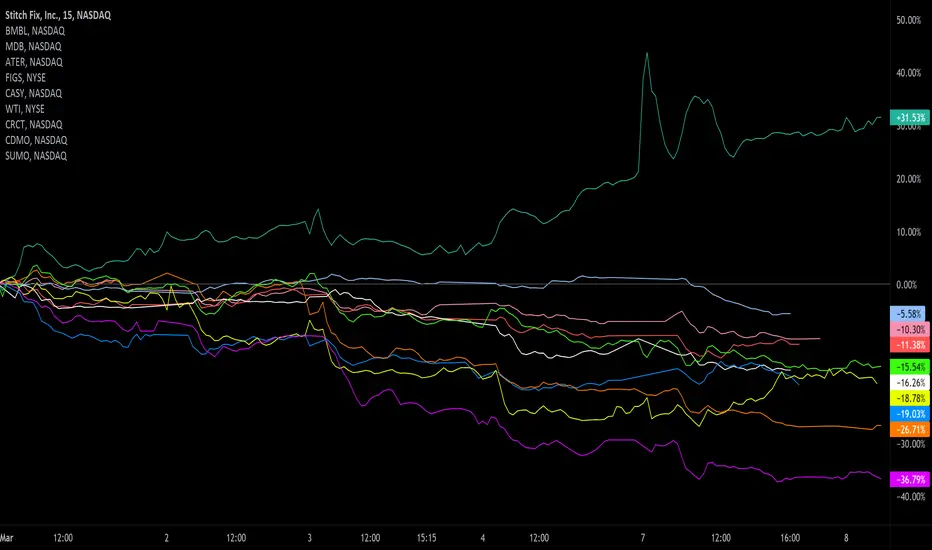
Earnings watch 3/8 post-marketEarnings watch 3/8 post-market:
SFIX
BMBL
MDB
ATER
FIGS
CASY
WTI
CRCT
CDMO
SUMO
Do your own due diligence, your risk is 100% your responsibility. This is for educational and entertainment purposes only. You win some or you learn some. Consider being charitable with some of your profit to help humankind. Good luck and happy trading friends...
*3x lucky 7s of trading*
7pt Trading compass:
Price action, entry/exit
Volume average/direction
Trend, patterns, momentum
Newsworthy current events
Revenue
Earnings
Balance sheet
7 Common mistakes:
+5% portfolio trades, capital risk management
Beware of analyst's motives
Emotions & Opinions
FOMO : bad timing, the market is ruthless, be shrewd
Lack of planning & discipline
Forgetting restraint
Obdurate repetitive errors, no adaptation
7 Important tools:
Trading View app!, Brokerage UI
Accurate indicators & settings
Wide screen monitor/s
Trading log (pencil & graph paper)
Big, organized desk
Reading books, playing chess
Sorted watch-list
Checkout my indicators:
Fibonacci VIP - volume
Fibonacci MA7 - price
pi RSI - trend momentum
TTC - trend channel
AlertiT - notification
tickerTracker - MFI Oscillator
www.tradingview.com
Short Squeeze - Buy Puts in SFIXSFIX price action has been steadily down trending since 6/2020. November earnings created a gap down that has consolidated through the holidays.
I am looking to take advantage of a continued downtrend with Put options.
Trade factors
1. Tight squeeze.
2. RAF nearing the midpoint. Not there yet, so I will look to buy the puts at a higher than 1/7/22 price.
3. Vscore is resistance and solid Profile resistance.
4. 21/34 Propulsion Dots show continued trend momentum.
5. VWAP, 21 Propulsion, and Darvas levels are aligned to provide upward price resistance.
6. Buy 18 MARCH 22 20 Puts @ 19.95, 20.45 and 21.95.
7. Profit @ 18.05
8. Stop Loss @ 25% Option Loss.
Good Luck!

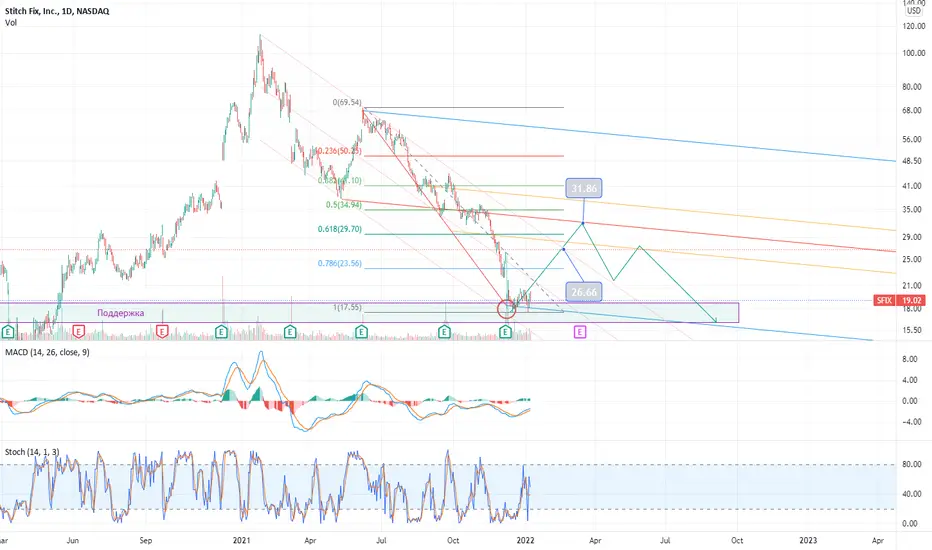
We know our worthStitch Fix has announced that its Board of Directors has approved a share buyback program under which Stitch Fix can acquire up to $150 million of Class A common shares. This statement pushed the stock up by 10%. But is there still potential?
- The price is in the zone of long-term support (since 2018).
- From the point of view of waves. We have completed the 3rd correction wave and now there should be a rebound within 4.
- From the point of view of forks, the price should test the equilibrium channel, and this is the $ 31 zone.
- If you look at the trend channel, the price is at the lower border of the channel and an increase up to 27.5 is possible.
I think there are enough arguments for growth.
SFIX: doing really badFrom a technical standpoint the stock is in a strong downtrend. From a fundamental prospect the company is failing and on his way to getting delisted.
I think you always have to be careful shorting these high short interest stocks because a short squeeze can happen from time to time. But make no mistake. It's going down.

SFIX - st longAfter the heavy downtrend and a possible sell out - price should now stabilizise & gain some momentum.
so a correction move to about $25 is favoured.
RISK : a restest of the recent lows cannot be ruled out, but the next bigger move is up.

Predictions on my holdings!!What are your predictions?? I have taken a few losses this quarter but I believe that with these predictions I can make back my money and some more.

$SFIX. Long Trade. Targets On Chart. Calls bought to see this stock move back up. Targets are on the original $SFIX post published on 9/21. (link below)
These thoughts are my own ideas based off my own analysis. Please do your own research before putting your own money into the markets.


will keep this in my portfolio with a small %Stitch fix has strong negative momentum i will wait until this cools of then add it to my portfolio when supply chain issues are relieved this will be a lucrative company

SFIX - no rush, patienceWe see the triangle now. Unless we break it upwards, no need to jump the boat.
Need to wait and see roughly 1 week before I open a position. If we break up, then following fibo levels, we are good to go 40+

4-10-21 Gap ClosedThis stock got bullish fundamentals, hence the gap up. Today it used the weak market to close the previous gap.

High short float stock. Short squeezeThe recent ER has seen a surprise of 256% and a sharp gap up. Shorts will be forced to cover their positions in the next few days and the shorts are above 15% of the float. Not a long term hold, of course.
The big spike on volume also is a favorable indicator.

SFIX- Back to the 40sEarnings coming up tomorrow. I was shorting this stock when it was in the mid to high 50s all the way down to the low 40s. I am now a buyer at these levels.
RSI in the oversold territory. MACD flipping to green. Seems to be holding a gain on high volume even thru a TERRIBLE day for the market.
Its always a little nerve racking buying something on these "market crash" days, but remember buy low sell high is the name of the game. Also earnings tomorrow could easily make or break this play so I'm not getting too crazy with the buy button. However if investors like what they hear tomorrow, I think we can see 40s again very quickly
