SFIX looks like repeat pattern from previous spikesI don't see the spike in the same magnitude as the previous ramp but this could run further based on the previous ramps! I've been trading it on the dips and have had this in the portfolio since it's 18s to the ride to 50.
It's an interesting stock for me.
SFIX trade ideas


BULL SFIX 1 DAY Chart Long1) 50 MA about to cross UP 150 MA.
2) Double wall Fibonacci Support Line Meats 50 MA and that looks like strong support.
3) Stochastic and RSI is Undersold.
4) Volume little low so might drop to support line 2 get better volume and than go up.
But I Think its going to bounce up from 50 MA and Support 1 ( Red Pattern or Blue Pattern ). Will C

Buy SFIX at $24.50Much improved membership growth from most recent quarter earnings. Disruptive innovation in the retail industry with AI integrated in its service. FIB and the trend lines both agree that $24.50 is a great entry point.


SFIX Awaken sleeping GiantInitially I lost with this Stock, right after I jumped in it dropped almost 27%. so instead of Panic I just Bought More and Held on to the Tree as the storm blew by. Well it was creeping back last few weeks just now finally got to the point where I was not losing much. Earnings report comes out and WOW all sudden every one wanted this one. the Wick hit $37 dust settled and it hovering around $33 now, I hope this one will gain support hold at $33 and be ready for the next Jump SFIX turned out to be Interesting Stock to say the Least.
NASDAQ:SFIX

Preparing for March 11 earnings week (SFIX)
Brief overview:
- Earnings after close.
- End of Friday (3/9/2019) had an upturn in the after hours, trading above the VWAP, which indicates an uptrend
- This could be because investors have a good feeling about the earnings on Monday. However, there is no real telling of what can happen during earnings.
- Looking at the 3 year trend, it peaked in September at $53 (as of now, it's trading at around $25.70)
Diving into the charts:
- Huge gains in August:
- Why?
- Analyst upgraded SFIX to a buy
- Retail posted impressive quarterly reports, so overall sector was doing well
- It blew passed analyst estimated in reports for Q3
- Huge plummet from $53 to $22 around Q4 ER:
- Why?
- Q4 results scared off some investors
- Active clients increased only 2% at 2.74 million, missing estimates at 2.81 million
- There was a second plummet in December from $28 to $15.80
- Why?
- The entire market was skiddish
- Their earnings were good, but user growth didn't meet expectations. Active clients increased 7% at 2.93 million, missing estimates at 2.95 million.
- There was a bounce in Jan 2019
- Why?
- Entire market is recovering (and quickly... could be a bad thing?)
- Some investors believe the plummets in 2018 were an overcorrection.
What do I think?
- I'm no expert at reading charts or investing.
- Seeing a sharp increase in price in the after hours seems to make me want to be bullish
- I think SFIX is a long term stock and has a good chance of increasing its price value
- I would buy at open and sell before earnings. I would be weary to hold through an earnings call because anything can happen.

SFIX gonna fix my accountcurrently uptrending, the waters are beginning to clear up. Right on a key resistance level, right on my radar this week. Bullish

SFIX Earnings Conf CallMust have been one good conference call, SFIX was up 10% AH and then tanked. Now down 10%, ad sitting at $23 AH as I type this.
I doubt anyone is gonna buy this pig other than shorts covering. Quite frankly, the reviews for Stitchfix are terrible. Don't buy stock in any company that you wouldn't do business with. Not sure why anyone would want a company that sends Sperry products, especially if you have to ship to return stuff. That's more work than going shopping for stuff you actually want.
AH action looks bad enough to call for a target of $18 before next earnings.


SFIX BounceBounce attempt
- peak volume
- 0.786 Fib
- Area of S/R
- previous move bull flag- broke out and paid at target- consolation time again
- Bullish divergence RSI- 15 min
- Bullish divergence MACD- 15 min
- 4 Hr MACD histogram crazy extended
- potential EW ending point
worst case SFIX is ast a conflunce zone-- best case bounce and PAYDAY


Bullish engulfing . Clear retracement found support Bullish engulfing . Clear retracement found support

Watching for return to Fib support after earnings dropDropping hard on earnings, but it seems to be mid-range between Fib levels and below the previous July resistance area. I'm watching for a retest of 30, at which point I'll buy in for a rebound and continuation of the uptrend since June. It's a volatile stock, but this feels like the best move for risk-reward.

So much for my first earnings play...Blew through my lower strike...Damn. Hoping she moves up a little tomorrow.


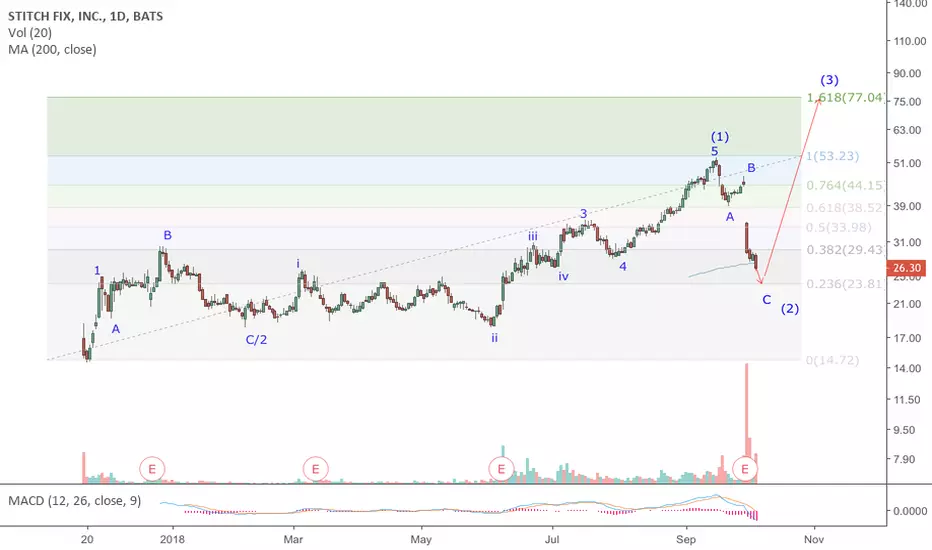
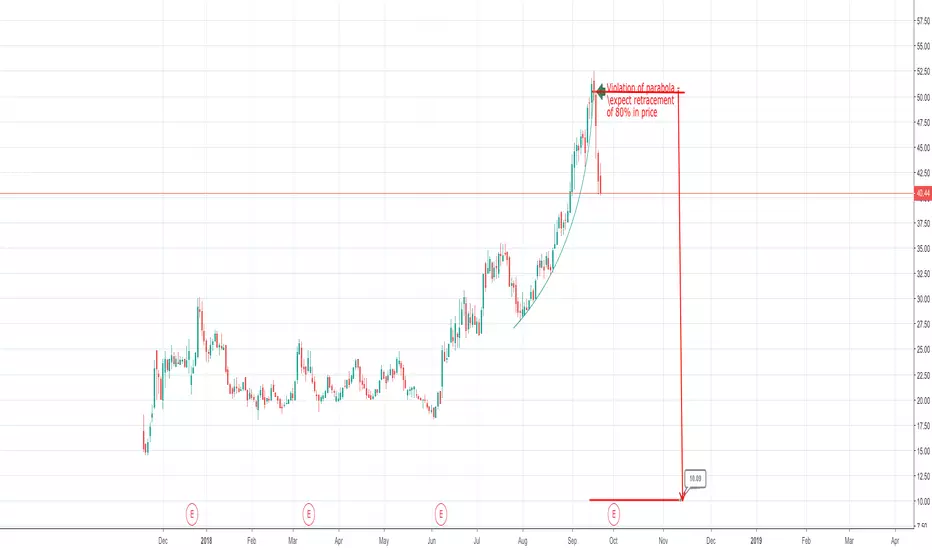
SFIX Violation of parabolic advanceRule of thumb on TA that violation of parabolic advance generally leads to 80% decline in value - see BTC hx - SFIX violated parabolic advance at around 50.45 - see related tweet from Peter Brandt regarding BTC

$SFIX Overbought at Resistance$SFIX Looking very overbought after an analyst price target increase earlier today. Money flow (MFI) has been on the decline since last week diverging from price action. Expecting a near term price correction.
Targeting $44.00 level at least, we will see if that holds as support...further downside possible.
Note: Informational analysis, not investment advice.
