SIGI – Potential Reversal and Bullish Momentum AheadSelective Insurance Group (SIGI) is showing early signs of a potential bullish reversal after a sharp sell-off. This week, the stock has rebounded strongly from recent lows, closing above the $81 mark with increased trading volume, indicating renewed buying interest.
From a technical perspective:
Next report date
—
Report period
—
EPS estimate
—
Revenue estimate
—
6.15 USD
207.01 M USD
4.87 B USD
60.31 M
About Selective Insurance Group, Inc.
Sector
Industry
CEO
John J. Marchioni
Website
Headquarters
Branchville
Founded
1926
FIGI
BBG000BSZ738
Selective Insurance Group, Inc. is an insurance holding company, which engages in the provision of property and casualty insurance products. It operates through the following segments: Standard Commercial Lines, Standard Personal Lines, E&S Lines, and Investments. The Standard Commercial Lines segment offers insurance products and services to commercial customers, such as non-profit organizations and local government agencies. The Standard Personal Lines segment consists of insurance products and services, including flood insurance coverage. The E&S Lines segment includes insurance products and services provided to customers who have not obtained coverage in the standard marketplace. The Investments segment refers to premiums collected by various segments and engages in the issuance of debt and equity securities. The company was founded by Daniel L. B. Smith in 1926 and is headquartered in Branchville, NJ.
Related stocks
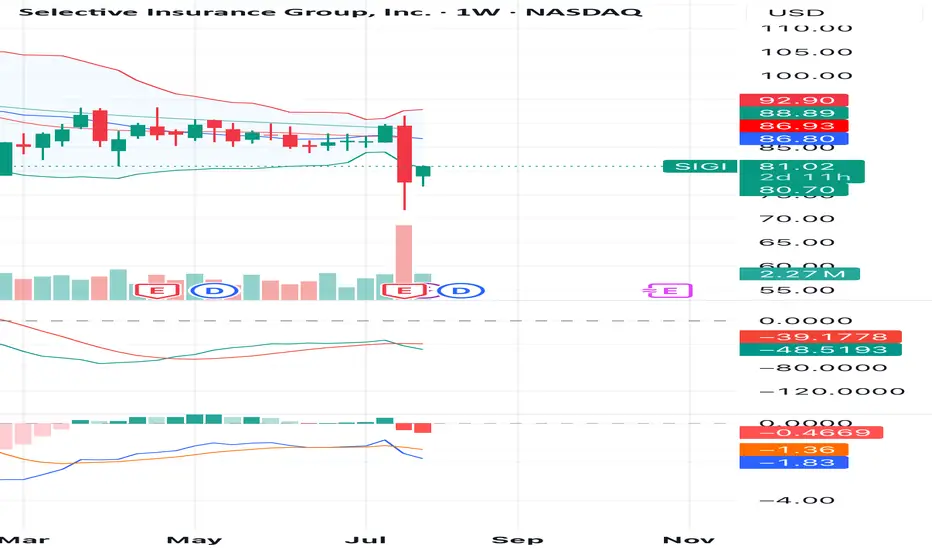

SIGI is set to grow furtherSelective Insurance Group, Inc. SIGIis testing several technical factors at the moment.
Firstly, the stock finished yesterday’s session forming second bullish engulfing in five days which resulted in RSI(5) divergence.
Secondly, the share price has currently stopped its downward correction at its

See all ideas
Summarizing what the indicators are suggesting.
Neutral
SellBuy
Strong sellStrong buy
Strong sellSellNeutralBuyStrong buy
Neutral
SellBuy
Strong sellStrong buy
Strong sellSellNeutralBuyStrong buy
Neutral
SellBuy
Strong sellStrong buy
Strong sellSellNeutralBuyStrong buy
An aggregate view of professional's ratings.
Neutral
SellBuy
Strong sellStrong buy
Strong sellSellNeutralBuyStrong buy
Neutral
SellBuy
Strong sellStrong buy
Strong sellSellNeutralBuyStrong buy
Neutral
SellBuy
Strong sellStrong buy
Strong sellSellNeutralBuyStrong buy
Displays a symbol's price movements over previous years to identify recurring trends.
SIGI4804229
Selective Insurance Group, Inc. 5.375% 01-MAR-2049Yield to maturity
6.46%
Maturity date
Mar 1, 2049
SIGI6011770
Selective Insurance Group, Inc. 5.9% 15-APR-2035Yield to maturity
5.48%
Maturity date
Apr 15, 2035
SIGI.GF
Selective Insurance Group, Inc. 6.7% 01-NOV-2035Yield to maturity
5.21%
Maturity date
Nov 1, 2035
SIGI.GG
Selective Insurance Group, Inc. 7.25% 15-NOV-2034Yield to maturity
5.11%
Maturity date
Nov 15, 2034
See all SIGI bonds
Frequently Asked Questions
The current price of SIGI is 77.60 USD — it has decreased by −0.28% in the past 24 hours. Watch Selective Insurance Group, Inc. stock price performance more closely on the chart.
Depending on the exchange, the stock ticker may vary. For instance, on NASDAQ exchange Selective Insurance Group, Inc. stocks are traded under the ticker SIGI.
SIGI stock has risen by 0.97% compared to the previous week, the month change is a −9.11% fall, over the last year Selective Insurance Group, Inc. has showed a −8.72% decrease.
We've gathered analysts' opinions on Selective Insurance Group, Inc. future price: according to them, SIGI price has a max estimate of 97.00 USD and a min estimate of 72.00 USD. Watch SIGI chart and read a more detailed Selective Insurance Group, Inc. stock forecast: see what analysts think of Selective Insurance Group, Inc. and suggest that you do with its stocks.
SIGI reached its all-time high on Mar 28, 2024 with the price of 109.58 USD, and its all-time low was 0.34 USD and was reached on Sep 23, 1976. View more price dynamics on SIGI chart.
See other stocks reaching their highest and lowest prices.
See other stocks reaching their highest and lowest prices.
SIGI stock is 1.36% volatile and has beta coefficient of 0.41. Track Selective Insurance Group, Inc. stock price on the chart and check out the list of the most volatile stocks — is Selective Insurance Group, Inc. there?
Today Selective Insurance Group, Inc. has the market capitalization of 4.76 B, it has increased by 0.35% over the last week.
Yes, you can track Selective Insurance Group, Inc. financials in yearly and quarterly reports right on TradingView.
Selective Insurance Group, Inc. is going to release the next earnings report on Oct 28, 2025. Keep track of upcoming events with our Earnings Calendar.
SIGI earnings for the last quarter are 1.31 USD per share, whereas the estimation was 1.51 USD resulting in a −13.52% surprise. The estimated earnings for the next quarter are 1.63 USD per share. See more details about Selective Insurance Group, Inc. earnings.
Selective Insurance Group, Inc. revenue for the last quarter amounts to 1.29 B USD, despite the estimated figure of 1.32 B USD. In the next quarter, revenue is expected to reach 1.24 B USD.
SIGI net income for the last quarter is 85.94 M USD, while the quarter before that showed 109.90 M USD of net income which accounts for −21.80% change. Track more Selective Insurance Group, Inc. financial stats to get the full picture.
Yes, SIGI dividends are paid quarterly. The last dividend per share was 0.38 USD. As of today, Dividend Yield (TTM)% is 1.91%. Tracking Selective Insurance Group, Inc. dividends might help you take more informed decisions.
Selective Insurance Group, Inc. dividend yield was 1.53% in 2024, and payout ratio reached 44.30%. The year before the numbers were 1.26% and 21.41% correspondingly. See high-dividend stocks and find more opportunities for your portfolio.
As of Aug 12, 2025, the company has 2.8 K employees. See our rating of the largest employees — is Selective Insurance Group, Inc. on this list?
Like other stocks, SIGI shares are traded on stock exchanges, e.g. Nasdaq, Nyse, Euronext, and the easiest way to buy them is through an online stock broker. To do this, you need to open an account and follow a broker's procedures, then start trading. You can trade Selective Insurance Group, Inc. stock right from TradingView charts — choose your broker and connect to your account.
Investing in stocks requires a comprehensive research: you should carefully study all the available data, e.g. company's financials, related news, and its technical analysis. So Selective Insurance Group, Inc. technincal analysis shows the strong sell today, and its 1 week rating is sell. Since market conditions are prone to changes, it's worth looking a bit further into the future — according to the 1 month rating Selective Insurance Group, Inc. stock shows the sell signal. See more of Selective Insurance Group, Inc. technicals for a more comprehensive analysis.
If you're still not sure, try looking for inspiration in our curated watchlists.
If you're still not sure, try looking for inspiration in our curated watchlists.