SMH trade ideas

Opening (IRA): SMH August 19th 150 Short Put... for a 1.54 credit.
Comments: Adding another unit of semiconductors here (IVR/IV 72/47) in weakness/higher IV, targeting the <16 delta strike paying around 1% of the strike price in credit in the August monthly (the weeklies aren't all that liquid). Still have the August 19th 175's on.

$SMH - Head and shoulder break down$SMH has been in down trend from head & shoulder breakdown. The next support point would be around $177 which is 1.618 fib extension area as well as head and shoulder measured move projection. If $177 area doesn't hold we could see $151 area which is the pre-pandemic high area. The worst case is $108 which should be absolute bottom if we reach there.
Target 1 - $177
Target 2 - $151
Target 3 - $108 (absolute worst case like China invades Taiwan kind of situation)
Disclaimer - Not an investment advice.

MACRO bearish thesis semiconductorsHey all,
I wanted to share my thoughts with you guys regarding semiconductors as that was one of the sectors people were most bullish on back when the market seemingly could only go up. That is no longer the case. If you look at names like AMAT and TSM, the distribution on semiconductors is in the past, and now we are in the markdown phase(A lot of false breakouts and Wyckoff distribution looks across the board). Semiconductors are very cyclical stocks and are still relatively overvalued compared to the rest of the market. I am actually quite bullish on semiconductors over the short term and fundamentally, but I do anticipate names in the industry to resolve lower and rallies to be faded. As a bear, I would wait to short significant rallies- watch the next few weeks as I think semis are going to rally in July.

Opening (IRA): SMH August 19th 175 Short Put... for a 1.76 credit.
Comments: Targeting the <16 delta strike in the August monthly (53 DTE) paying around 1% of the strike price in credit. Adding a smidge of long delta back into my portfolio to keep my net delta happy using an ETF that is closely correlated with the broad market (SPY 3-month correlation of .92) instead of cluttering up my IWM, QQQ, and SPY short put ladders further.
Other ETF's to do this with: XLK (.97 3-month correlation), EFA (.90).

Semiconductors - SMH / WeeklyOuch.
Looks as if the NQ won't be going anywhere without the
Semis.
This Sector wins hands down for the Big Ugly.
_________________________________________________
Waiting on the Rain.

Break of structureBreak of structure
Gap up on open and waited for pullback and brought calls on continuation

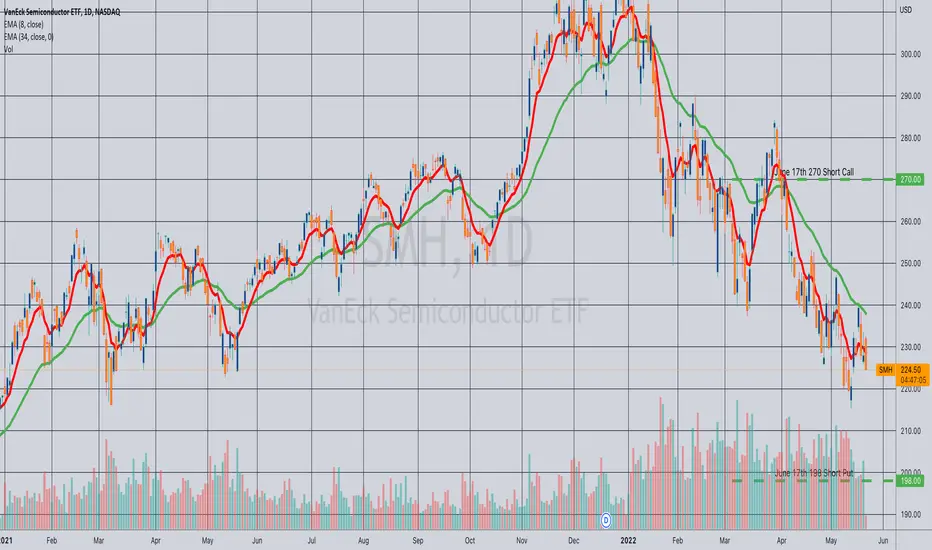
Closing: SMH June 17th 198/270 Short Strangle... for a 3.43 debit.
Comments: Filled for a 5.55 credit (See Post Below). Taking 2.12 ($212) worth of profit here ... .
$spy $qqq $smh A major artery has been cutDown side target from H&S top is 179 which coincides with the .618 retracement from march 20 low to high. See you there soon.

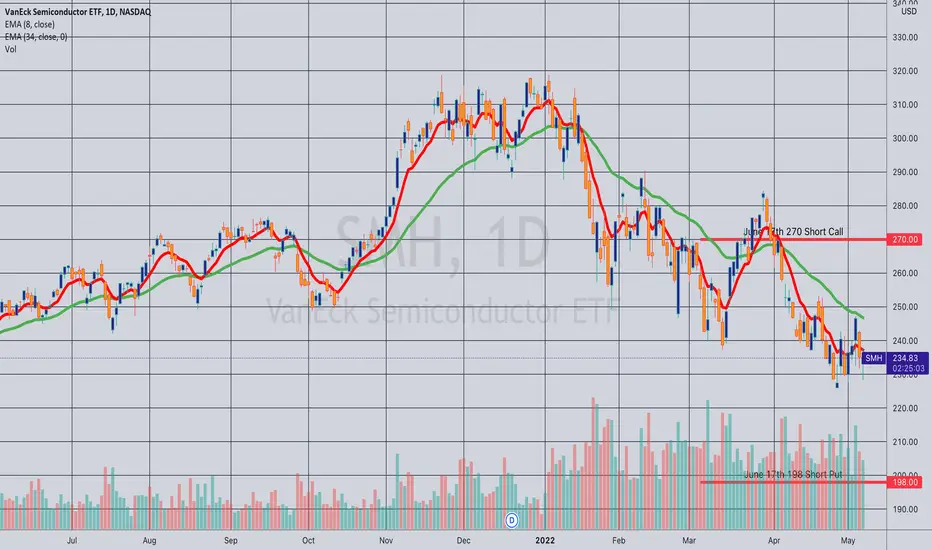
Opening: SMH June 17th 198/270 Short Strangle... for a 5.55 credit.
Comments: High IVR/high IV (80/46). Selling the 15 delta strikes on both sides. 5.55 credit on buying power effect of 23.58; 23.5% ROC as a function of buying power effect at max; 11.8% ROC at 50% max. As usual, will look to take profit at 50% max and/or manage sides on approaching worthless/side test.
Semiconductor ETF buySMH Semiconductor ETF is at a major support trendline (white dash) and EMA377 (blue line). SMH is a screaming buy now. Technically speaking, there is essentially no downside risk and plenty of upside reward at this entry point. Computer chips, also known as semiconductors, are the brains of products like smartphones, computers, cars, medical devices, digital cameras, TVs, washing machines, refrigerators, every appliance, LED bulbs, ATMs, trains, planes, the internet, communications, pretty much everything..
WASHINGTON, April 6 (Reuters) - The White House held a classified briefing on Wednesday with some U.S. lawmakers on the dire risks to the American economy from semiconductor supply chain issues as it pushes Congress for $52 billion in funding to subsidize production.
Do your own due diligence, your risk is 100% your responsibility. This is for educational and entertainment purposes only. You win some or you learn some. Consider being charitable with some of your profit to help humankind. Good luck and happy trading friends...
*3x lucky 7s of trading*
7pt Trading compass:
Price action, entry/exit
Volume average/direction
Trend, patterns, momentum
Newsworthy current events
Revenue
Earnings
Balance sheet
7 Common mistakes:
+5% portfolio trades, capital risk management
Beware of analyst's motives
Emotions & Opinions
FOMO : bad timing, the market is ruthless, be shrewd
Lack of planning & discipline
Forgetting restraint
Obdurate repetitive errors, no adaptation
7 Important tools:
Trading View app!, Brokerage UI
Accurate indicators & settings
Wide screen monitor/s
Trading log (pencil & graph paper)
Big, organized desk
Reading books, playing chess
Sorted watch-list
Checkout my indicators:
Fibonacci VIP - volume
Fibonacci MA7 - price
pi RSI - trend momentum
TTC - trend channel
AlertiT - notification
tickerTracker - MFI Oscillator
www.tradingview.com

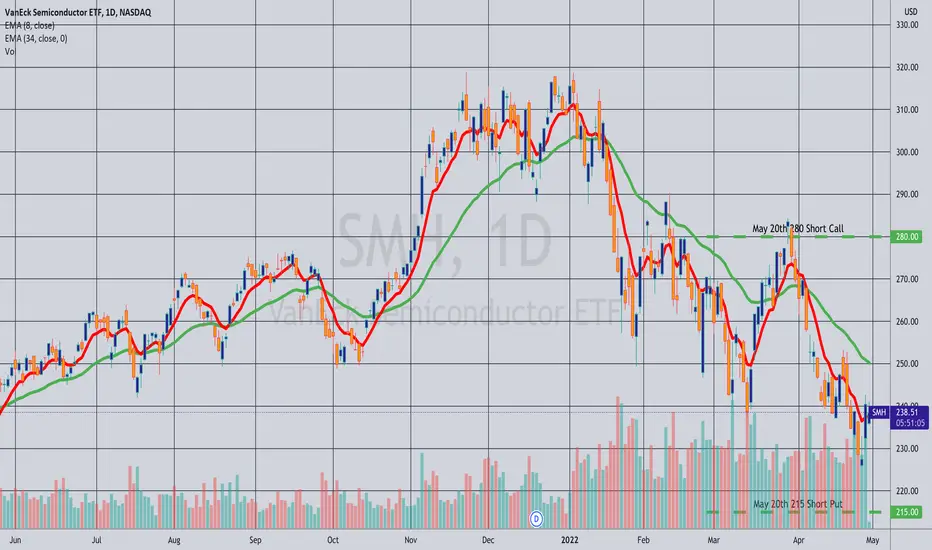
Closed: SMH May 20th 215/280 Short Strangle... for a 3.44 debit.
Comments: Filled for a 5.20 credit (See Post Below). Out here for 3.44; 1.76 ($176) profit.

SMH ETF - Quick TradeThe Elliott counts would suggest that there is an opportunity to go long at market and at 224. The correction will follow to take prices higher to 252.

4/24/22 SMHVanEck Semiconductor ETF ( NASDAQ:SMH )
Sector: Miscellaneous (Investment Trusts/Mutual Funds)
Market Capitalization: $ --
Current Price: $234.73
Breakdown price (hold below): $237.35
Sell Zone (Top/Bottom Range): $241.85-$261.90
Price Target: $206.40-$204.00
Estimated Duration to Target: 67-72d
Contract of Interest: $SMH 6/17/22 200p
Trade price as of publish date: $4.35/contract

$SMH 30m$SMH right under zone of resistance. Tomorrow either breakout or rejects. Can play the underlyings instead as well.

SMH is in play this week with TSM reporting earningsSo, we have not seen the confirmation yet that the economy is slowing down. Semi is getting crushed because China is in lock down. These are very high valuation with a likely change to more defensive spending budgets this quarter.

Opening: SMH May 20th 215/280 Short Strangle... for a 5.30 credit.
Comments: Selling some nondirectional premium in semiconductors (implied volatility rank 60/30-day 41.2%) in the May monthly (42 days 'til expiry). 5.30 on buying power effect of 24.94 (on margin); 21.3% ROC at max as a function of buying power effect; 10.6% at 50% max.

$SMH 15mSMH, semis etf still holding this breakout area. If we fail to hold then fall back in the triangle otherwise this is a break retest bounce type of scenario. In market analysis semis didn't do so well today compared to the rest of the market

Semi's attempting to break through resistance,what does it mean?The Semiconductor ETF SMH is meeting resistance here @ 260. The last several times the SMH index ETF met this trend resistance has resulted in a push to lower lows. Could this time be different? The MFI (Money Flow Index) seems to be suggesting it is a possibility. Although SMH is riding a downtrend, SMH price volume momentum is in overbought territory. A SMH break and close above 260 on a daily basis would end the SMH down turn. The next important area to watch would be 266. 266 is where major resistance resides. This is evidenced by the significant battle between bulls and bears previously waged there noted in Volume @ Price. The last time @ 266, the bears got the better of the SMH bulls. However, this SMH MFI is trending higher as opposed to lower. This is a canary in the coal mine to watch as this battle could have repercussions as to the future direction of the broad market trend and ensuing market leadership.

A little more pain ahead for SemisLooking for a fill of the gap at 232 which coincides with the 2.0 extension of this 5-wave move down. Head & Shoulders pattern with negative MACD divergence.

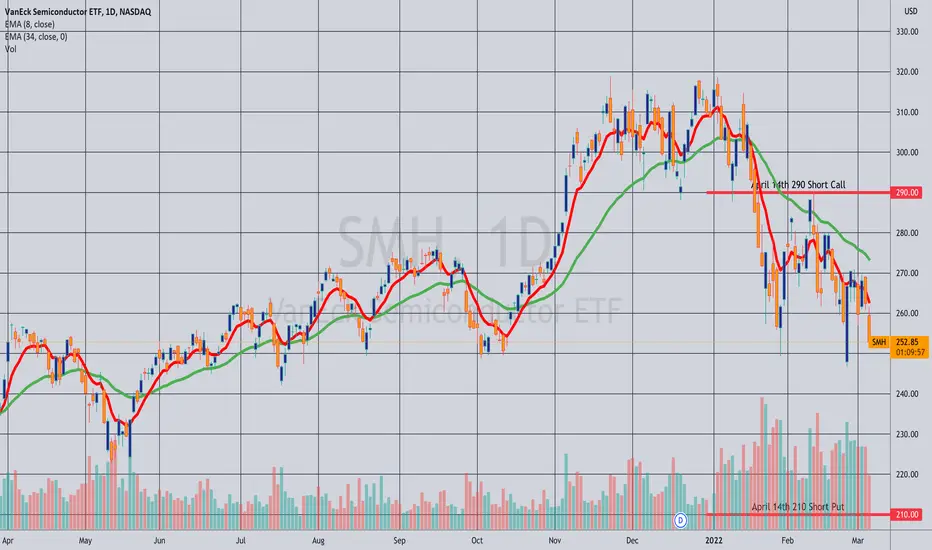
Closed: SMH April 14th 20/290 Short Strangle... for a 4.29 credit.
Comments: Received a 5.90 credit for putting this on 6 days ago. (See Post Below). Taking 1.61 ($161) of profit here -- 27% of max with 35 days to go.
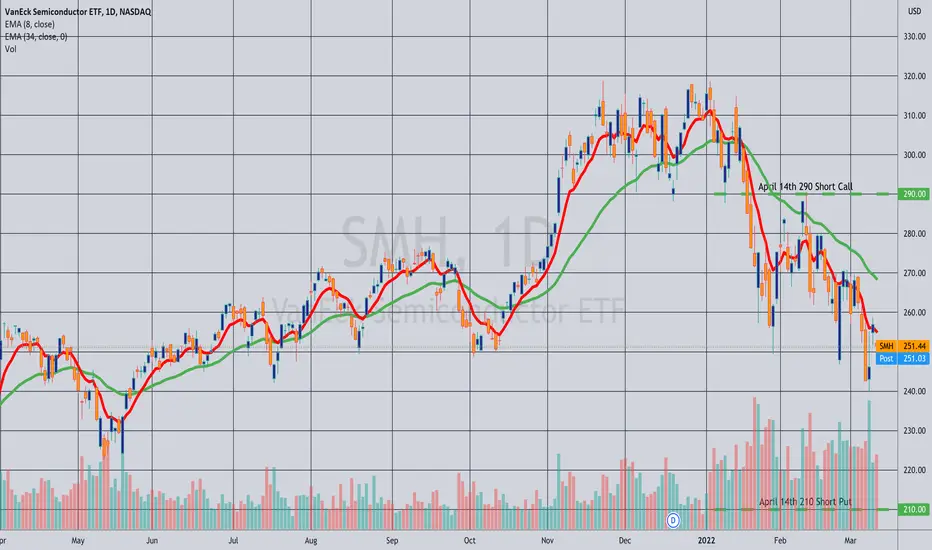
Opening: SMH April 14th 210/290 Short Strangle... for a 5.90 credit.
Comments: High IVR/high IV (96/48.5). Selling the 15 delta-ish strikes on both sides; 5.90 credit on buying power effect of 25.37 (on margin); 23.3% ROC at max; 11.6% at 50% max.