$SMH Semiconductors Double TopNASDAQ:SMH Semiconductors on a weekly chart tested a Double Top. Now we have to watch if SMH will consolidate in a bullish way and the break out or does it sell off like it did in 2022.
SMH trade ideas

U-shaped volume pattern
A U-shaped volume pattern is a technical analysis indicator that can be used to identify potential turning points in the price of a security. The pattern consists of a sharp increase in volume followed by a sharp decrease in volume, which forms a U-shape on the chart.
The U-shaped volume pattern is often interpreted as a sign that a trend is coming to an end. The sharp increase in volume at the beginning of the pattern indicates that there is a lot of buying or selling pressure in the market. This pressure can push the price of the security up or down, depending on the direction of the trend.
The sharp decrease in volume at the end of the pattern indicates that the buying or selling pressure is starting to dissipate. This can be a sign that the trend is losing momentum and that a reversal is possible.
Of course, the U-shaped volume pattern is not always a reliable indicator of a turning point. The pattern can also be formed for other reasons, such as a news event or a technical event. As a result, it is important to use the pattern in conjunction with other technical indicators and to consider the broader market context before making any trading decisions.
Here are some of the factors that can cause a U-shaped volume pattern:
News events: A major news event, such as a company earnings report or a change in interest rates, can cause a sharp increase in volume. This is because investors are rushing to buy or sell the security in response to the news.
Technical events: A technical event, such as a breakout or a breakdown, can also cause a sharp increase in volume. This is because traders are entering or exiting the market in response to the technical signal.
End of a trend: The end of a trend can also cause a U-shaped volume pattern. This is because the buying or selling pressure that was driving the trend is starting to dissipate.
If you see a U-shaped volume pattern on a chart, it is important to consider the broader market context before making any trading decisions. If the pattern is forming in a strong trend, it is more likely to be a reliable indicator of a turning point. However, if the pattern is forming in a weak trend, it is less likely to be a reliable indicator.

Head and shoulders on Semis? SMH might be filling the gap downPretty self-explanatory. This pattern not looking good. Fibs and gaps all line up. hard to see how we dont pull back. Open to your thoughts, as always

Head and shoulders on SMH ???It looks like there is a potential head and shoulders forming on the NASDAQ:SMH

SMH Entry, Volume, Target, StopEntry: when price clears 151.71
Volume: with daily volume greater than 13.30M
Target: 167 area
Stop: Depending on your risk tolerance; 146.62 gets you 3/1 Risk/Reward.
This swing trade idea is not trade advice and is strictly based on my ideas and technical analysis. No due diligence or fundamental analysis was performed while evaluating this trade idea. Do not take this trade based on my idea, do not follow anyone blindly, do your own analysis and due diligence. I am not a professional trader.

SMH too good to be trueI don't have much to go on but that is fine. I just use the trend pivot line to put my back against (like a stop loss) So the margin of loss is minimal if the trade fails. I call this area the position of maximum opportunity.

SMH - Pennant break?SMH could go either way but my guess based on price action over the last couple days is that it will break lower. Little oversold bounce today but hitting downtrend resistance and Fib resistance on light volume. Looking for a break. QQQ helping out with momentum but also about to hit resistance.

SMH Entry, Volume, Target, Stop, ResistanceWhen price clears 131.79
With WEEKLY volume greater than 39.87M or DAILY volume greater than 7.28M
Target: 149.50 area
Depending on your risk tolerance: 125.88 gets you 3/1 Risk/Reward.
Resistance: 142 and 145 area
This trade idea is not trade advice. This idea is strictly based on my ideas and technical analysis. Not due diligence or fundamental analysis was performed while evaluating this trade idea. Do not take this trade based on my idea, do not follow anyone blindly, do your own analysis and due diligence. I am not a professional trader.

SMH Update (daily chart)SMH recently peaked at 151.71 on May 30, leaving behind two gaps for potential fill in an area of low volume (yellow volume profile highlight). I am expecting a selloff into the gap areas, which also are at key fib levels.
5/30: peak = 151.71
143.89 = 76% fib (Touched today, and 5.2% off peak)
139.05 = 61.8% fib ( 8.3% off peak)
135.14 = 50% fib (10.9% off peak)
The volume profile is based on quarter to date activity, March - today, June 5. I do not expect a bounce off today's low, the 61.8 % or 50% fib areas look more realistic to me.

SMH - running out of steam?SMH getting a lift today from everything except NVDA. AMD TSM and others holding things up and still no real correction in SMH since NVDA earnings and subsequent ramp of all other things "AI". At some point big cap tech and semis will be sold and a correction will ensue. Perhaps sooner than we think.

SMH NVDA SPY & QQQ | Long Term Outlook Resistance Guide- SMH weaker than QQQ today potentially setting daily lower high but bears need more follow through at the moment
- NVDA still potential 4h head and shoulders pattern if we confirm more downside
- SPY very nearing 0.618 fib resistance we saw some money rotate from tech into SPY in the last two days making breath better
- QQQ bull flag confirm still super strong every trend is healthy no closed just at the golden pocket resistance. Most likely scenario is weekly consolidation in the next coming weeks.

$SMH Invers Head & shouldersNASDAQ:SMH Broke through double top. Invers Head & shoulders target horizontal line.

SPY & QQQ indecision Day | Support & Resistance Guide - SPY back tested prior resistance and so far held it triple bottom today on 5m time frame around 417 range
- Key question is which way do we break on Monday if we break bear we can potentially go back into our 1.5 month long chop zone.
- Can SPY hold this support zone if QQQ consolidates/slight pullback next week?
- first day we see SMH a slow down a bit versus QQQ

SMH Weekly Update (post split)I'm updating my prior SMH weekly chart, since we had a 2 for 1 split in SMH last week and it totally messed my chart up.
Key points (dates are all weekly):
3/27: 131.79 (most recent peak)
4/24: 118.57 ( most recent low) -10.03% off the peak
5/1 close: 124.38 -5.6% off the peak
Gann confluence line 1: 121.71 -7.6% off peak
Gann confluence line 2: 114.46 -13.1% off peak
The green trend lines indicate an apex forming right along the Gann rays (salmon colored lines) suggesting a directional resolution is near.
After extending to the purple point D, which is almost a 1.218 Gartley extension, support appears to be holding at the 121.71 Gann Confluence support line. This line is also the top ridge of the Ichimoku cloud which can also serve as support. Should SMH rise off this support, then we would have had a 7.6% correction off the most recent high.
Should current support break down, we would see a target of Gann support 2 which is 114.46, or 13.1% off most recent peak.
Pros for upside breakout: A possible rate cut currently being predicted by SOFR futures as early as June or July. Banking turmoil could also call for a pause or cut. A reduction in rates would also signal easier monetary conditions which would benefit growth oriented stocks for a near term spike.
Pros for a breakdown: Further hawkishness in the FED, combined with Bank Solvency fears. Seasonality: from 2004 to 2023 the SMH has finished the month of June higher only 42% of the time, the worst month in the year.
Observation: The 12 month RSI, while positive at 57.16, is declining from a near term double top, and showing some weakness in trend. I would watch for continuing weakness in SMH momentum on the daily chart, as well as the breadth inside the SMH holdings. You can do this with flipcharts on the Barchart.com site. Presently, while I see a few stalwarts, I am also seeing a lot of breakdowns inside the SMH ETF. For example, MCHP, a very well run company with solid financials, just reported good earnings beats, yet it sank below its 200 day MA and has a weak daily RSI(9) of 42.11. Personally, I would not long any semiconductors until late summer and signs of turmoil have resolved.

SMH - LONGAlright back into SMA today .. this is my second try .
We have a few gaps on record for the bulls in this three bar break and today we pulled of a Wedge pop taking back our EMA's . We still have not overcome any minor highs though and are still below the downtrend line for this leg down ..
Additionally we have FOMC rate decision out on the third so tomorrow is probably going to be muted and I am sure that in the next few days we will see some volatility like most FOMC meets seem to bring , especially in the decision day . I drew two scenarios of what might happen on the chart too , hoping to see us hold the emas and would be really nice to see the market overall go up vs reaction to FOMC decision .
Net short levels across the board ( per SPY, QQQ , DJI, France 40 , and German 40 ) remain elevated and very net short. Also , COT futures data still showing very large imbalance of leveraged money committed to short bets . What I would live to see is for those leveraged traders to be dished out another leg up and provide us with some extra liquidity to solidify the next move up .
Time will tell . The opposite could happen too . But I think that so far we have seem a lot of bad news that was bought and if we can make it through the next couple of days and not lose the current levels , there's good reason to support another move up in the markets . Also today we had 271 new highs vs 223 new lows , which might be a hint that breadth is improving , most days recently have had considerably more lows than highs , today could be a change of character with that.

SMH (Chip sector)SMH has been lagging behind the other tech sectors like XLC and XLK.
As you can see it broke its rising wedge support and started correcting.
You did that notice the drop if you focused on NVDA but if you look at TSM,AMD, and intc performance last 2 weeks of April you'll see where the selling came from.
the thing about using the Sectors to trade, is you can see the sector about to break out or correct but you just don't know which stock in that sector will be the recipient of such a move.
Here's an example.
You see How XLK was at support here in a do or die situation (Green arrow)? And then wham, msft beats earnings 😆
Another example is XLC
You see the big cup and handle ? And the surprise surprise META beats
That leads me to this, SMH has back tested its breakout after falling out of a wedge and has now formed a bullish falling wedge.
There's still alot of Redtape to get through though, SMH is the only tech sector below it's 21ema and 50sma . Will need to break over 250.
AMD and Qcom both have earnings this week, who will be the recipient of a bullish breakout here?
Things only get bearish here if SMH drops below 233

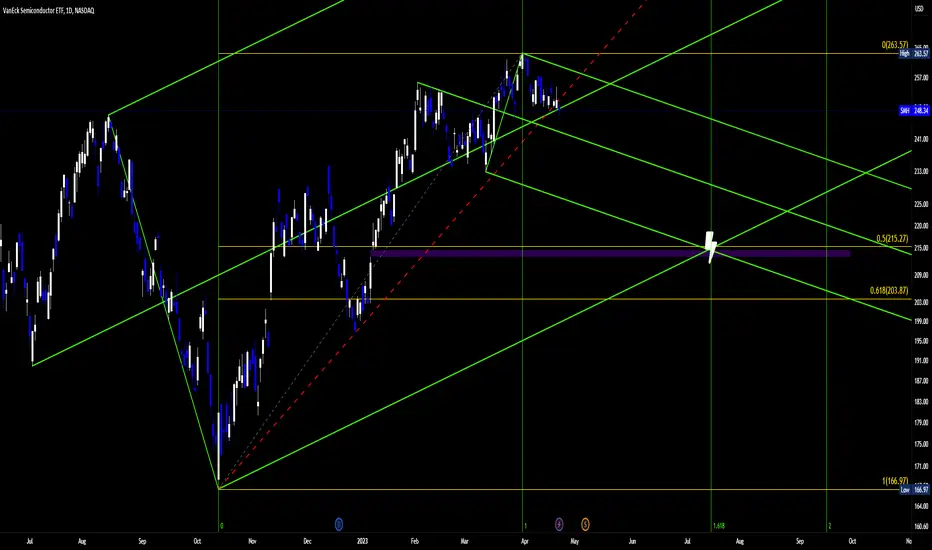
Short the ChipsNASDAQ:SMH
Short the Chips.
Why?
RSI Bearish Swing Rejection
MACD Bear Div
Price broke the ML
Unfilled Gap (212-215)
50% Fib Confluence with Price Gap
1.618 Time Zone
Fib Confluence X Price Gap X Energy Point
Target (Time x Price) = 215 USD on 7/17/23
Fat_Fat
SMH Semiconductors update (weekly) Key areas to watch Semiconductors finally showing some topping pattern, amidst topping RSI (12) that failed to reach the high 70 channel and a shrinking trend of volume. In effect, weakening momentum.
The first level is 244.71, which is a Gann confluence and also a prior pivot (left yellow circle), and is a 7.1% decline off the most recent peak of 263.57. This would take it to the top of the red cloud which could serve as some support.
The second level to watch is 229.18 (right yellow circle) , which is another Gann Confluence, and also a prior pivot, which would be 13.04% off the peak of 263.57. This would take SMH well into the cloud, which could create some future resistance.
Seasonality is at play, so I would expect a rebound in late summer, although there are many factors which could disrupt any projections any farther out and I do not feel worth making now.

SMH BULLISH COUNT STILL NEEDS 269/271 MINI have covered ALL SHORTS TODAY BASED ON this chart I still have a second C wave up to end the double zig zag . I know we have two legs up that are equal to the high but the structure down is corrective and back to 50% I will allow for a last wave up but cycles are running on fumes !!!

Accumulation Manipulation Distribution Ran into this 'AMD' concept on Twitter, never looked at charts as such. Can this NASDAQ:SMH Daily chart play out as such? Does it make sense to indicate Accumulation Manipulation and probable Distribution like this, or do we need more for this (?)
Keeping an eye on it this way is harmless. Let's watch and see how it plays out. Always keep learning.

SMH - LONGI bought some SMH today , S2 uptrend , one of the stronger groups rn. Related stock I may play as well is CRUS too , but has not given me a signal yet / only triggered .

$250 by April 17thThe movement appears to be going towards $250 by the 17th of April and then turning back up gradually for about 2 more weeks before it drops back down to around $225 nearing the end of June beginning of July time frame.

$spy $smh $qqq Bear market bounce?Looks like a very critical point for semi's right here. Failure is not an option.
