$SOFI Bullish Run Imminent Added some basic Fibonacci levels of retracement to further my opinion. However from basic price movement and these intense fluctuations over the last few months, from a technical standpoint this stock is primed, furthermore, fundamentally they are just as strong and have been reflecting this in quarterly and annual revenue growth. Get in now - I love this stock for a plethora of reasons.
Best,
Andrew Roupas
SOFI trade ideas

Looking for a wedge up in sofimore buying volume on the daily then selling volume. starting to close pretty flat. looking for a few green days here with a projection on the chart looking for about 16.39 and $17.05 or so to take major profits before opening spreads and waiting for a breakout but i think there will be some selling going on as this is now a highly traded stock imo. I love the company im bullish in general but again i love PLTR technologies and if anything happens those stocks going back to $15 bucks and Sofi $12. As for now i will continue to remain bullish.

Gap up for sofe next week?SO head and shoulders doesn't always look equal but we could we a strong gap fill the volume with bullishness is their.

Sofi Bull & Bear Casepretty self explaining seeing some resistance around 15$ keeps selling off early am heavily.... will need some strong buying from here or we could see mid $12's bear case. volume is there and its bullish but who knows what the computers holding on this one....

SOFI $15 support. MACCD and RSI are at the bottom looking for a reversal Target $22-$25.
Q3 strong - revenue beat / + usrs//
KBW PT $21 , MS TG $25 (Overweight)///
"SoFi Technologies (SOFI) shares climbed as much as 21% on Thursday, hitting a five-month intraday high, after the online lender reported a narrower loss and higher revenue for the most recent quarter and boosted its 2021 revenue outlook.
Following the market close Wednesday, SoFi posted a Q3 loss of $0.05 per dil"- Nov 11
Institutional Ownership 43.91 %
Total Shares Outstanding (millions) 807
Total Value of Holdings (millions) $5,191

SOFICould SOFI be doing a bounce from this level. It has done it multiple times in the past. If it can't bounce then it will head to the IPO price of 11. If it does bounce look for resistance at 17.78 level. I'm gonna stay bullish until the support is broken.

$SOFI - Potential descending triangle lower trendline reversalSofi has been testing the lower trend line inside a descending triangle. It has successfully held and bounced from that trend line 3 times prior and is expect to do so again.
Target 1 - $16.98
Target 2 - $19.12
Target 3 - $30
Risk - Price fall below $14.
———————————————————
How to read my charts?
- Matching color trend lines shows the pattern. Sometimes a chart can have multiple patterns. Each pattern will have matching color trend lines.
- The yellow horizontal lines shows support and resistance areas.
- Fib lines also shows support and resistance areas.
- The dotted white lines shows price projection for breakout or breakdown target.
Disclaimer: Do your own DD. Not an investment advice.

SOFIHang on we're nearly there
Wait until you can label a 5 clear impulse on the low timeframe before taking longs
Or if you're buying shares then it's probably to start scaling in
---------------------------------------

SOFI back in demand zone, just closed warrant redemptionJust days after a surprise earnings beat in November, SOFI announced a warrant redemption which subsequently sent it tumbling. Yesterday, 12/15, they announced the warrant redemption was completed, right as it entered into the demand zone.
RSI indicates we're in oversold territory and there's strong support in the 13.75-14.25 area. Financial sector stock are poised to do well heading into the new year with inflation skyrocketing.

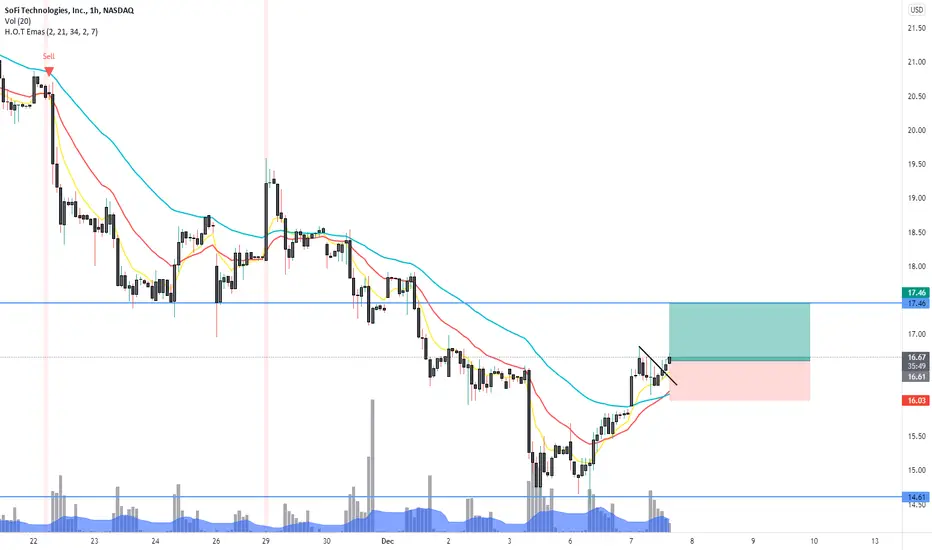
SOFI BullishAssuming the tech selloff is over for now Sofi appears to be in a good spot to benefit from a possible "Santa Claus Rally"
Price bounced off the $14, which has been significant support in the past and is now testing the weekly (up) trend line. Also the MACD is beginning to curl up, as is the Accum/Dist line.
D+ is moving up and D- is moving down signaling a possible trend reversal.
Short term target $16.51 and then up the fibonacci scale. Eventually this will return to previous highs and I feel it will be a strong stock to hold for the next several years.
weedkiller420.com

SoFi Technologies IncSofi Technologies looks like it wants to rally.
If sentiment changes and money flows back in, there could be nice returns on offer here.
What I am seeing is a triple bottom, telling me that the bulls will take control.
Take profits at $22 (50% return)
Stop loss at $12

Technical analysis on SoFi stock Check out the technical analysis on SoFi let me know of your thoughts and if you agree with the support and resistance levels. The RSI signals a oversold level but according to Macd analysis its not yet the time to pull the trigger

My plan!I eat crayons for breakfast and sell calls for lunch. Not sure how long this will take, and I'm sure it will all be a bit more compressed than my diagram.

Dip entries 🤑 bearish short term bullish longterm 🧐SOFI saw a big pullback after we saw the fakeout breakout i mentioned in my previous analysis. congrats if you went short/secured gains.
I believe shorts can keep paying until we hit 13 local support or extreme trendline support around 11-12.
goodluck traders! like and follow for more 💘

SOFINASDAQ:SOFI
I may buy @ 16.47 - 16.90
Sell Target I: 19.63 and Target II: 21.55
DISCLAIMER:
I am not a financial or investment advisor. All information found here, including any ideas, opinions, views, predictions, forecasts, commentaries, suggestions, or stock picks, expressed, or implied herein, are for entertainment purposes only and should not be construed as personal investment advice. If you decide to invest, please make your own decision, or contact the specialists’ institutions. Thank you

SOFI bottom inNASDAQ:SOFI
$SOFI most probably found it's bottom, looking at a bounce from the trend-line. Too much FUD out there at the moment so we'll see but I'm accumulating heavily at these levels. Fundamentals remains strong.


$sofii've actually been eying this stock for maybe a month now, i dont short or play puts so i waited patiently for entry. today i bought 400 shares and i am looking for this to make highs back to $22-$25. sofi seems to have a good army of investors and institutional holders. this could become a long term hold if bank charter news creeps closer anytime soon!

SOFI moving from bottomMassive flow coming into 07/15
Could have found a bottom
R:R is great and worth getting in at any pullback
[stock] SoFi - SOFI - Tell its not going to do it again! SoFi - SOFI - Tell its not going to do it again! What is the likelihood that SOFI will bounce again? Is it possible? What do you think? Edutainment Purposes Only!


SOFISOFI bounced at the 88.7
conservative wave 3 target with normal fib would be 32 and with log fib it would be 37 so if it plays out that would be the zone for partial profit taking
tho also need to watch intraday price action at the resistant at 19-20 too in case the move up was an X and not an impulse

SOFI, 4 Hours, Shark Analysis 2 SOFI, 4 Hrs Shark Shape. Analysis II
Buy between 16.15 - 15.60.
Buy between 14.67 - 13.12
Target I : 17.57 , Target II: 20.30
STOP LOSS @ 12.51
------------------------------
DISCLAIMER:
I am not a financial or investment advisor. All information found here, including any ideas, opinions, views, predictions, forecasts, commentaries, suggestions, or stock picks, expressed, or implied herein, are for entertainment purposes only and should not be construed as personal investment advice. If you decide to invest, please make your own decision, or contact the specialists’ institutions. Thank you
