Buy chip makersI think they are on sale, Chips may be ATH again.
Fundamentals are actually good thanks to data centers.
DDR5 is coming, it will cause some short-term pain for the DD4 but DD5 will be in shortage soon.
SOX trade ideas

Warnings Signs in the Chips?Semiconductors have been a key pillar of the S&P 500’s advance since 2016, and now they may be flashing a warning signal for the overall market.
This chart of the Philadelphia Semiconductor Index shows how gains have been slowing all year. Prices have squeezed into an increasingly narrow range, with the 50-day simple moving average (SMA) recently dipping within about 1 percent of the 100-day SMA.
Also notice the action as SOX tried to climb above 3300. After some initial closes at new highs, the candlesticks turned solid as early rallies got sold.
Next, looking at the weekly chart, MACD has steadily waned since February (bearish divergence). There was also a bearish outside week July 12-16, which SOX has yet to return above:
Finally, the chart below shows the ratio of SOX vs the SPDR Technology ETF (XLK). Notice how it’s been slipping since April – despite what should be a lot of good news involving strong demand for chips. This may suggest that, should another summer pullback occur, SOX may be especially vulnerable.
TradeStation is a pioneer in the trading industry, providing access to stocks, options, futures and cryptocurrencies. See our Overview for more.


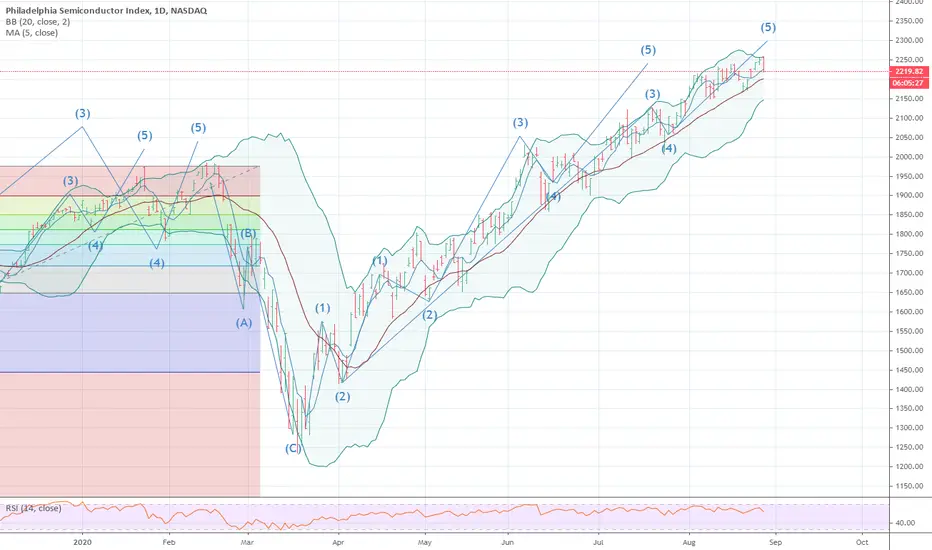
A last upmove til 2022 in semiconductors is possibleAfter the rally in semiconductors we should see a cool down of the rally, but with sustainable higher stock prices till 2022.
Then the correction in this sector should be take place.
So holding semiconductors or buying dips are possible this year.

The Bears Tried to Sink Chipmakers, and FailedChip stocks have lagged along with the broader technology sector. But just when you think they’re dead, they have a session like yesterday.
Notice how the Philadelphia Semiconductor Index opened 2.2 percent below its close the previous session. Also notice how quickly it bounced and ended the session up a full 2 percent.
The low was lower than Tuesday’s and the high was higher: a textbook bullish engulfing candle.
In isolation, that’s interesting for the bulls. But there’s more because the weekly chart is trying to form a bullish inside candle with a higher low and a lower high. Following a drop like we’ve seen in the last month, that can signal a steadying in price before a change in direction:
Next, stochastics have shown an oversold condition all month (on the daily chart). It’s gradually lifting.
Finally consider the descending trendline that began on April 27. This creates the potential for a bullish breakout if the current range holds.
TradeStation is a pioneer in the trading industry, providing access to stocks, options, futures and cryptocurrencies. See our Overview for more.

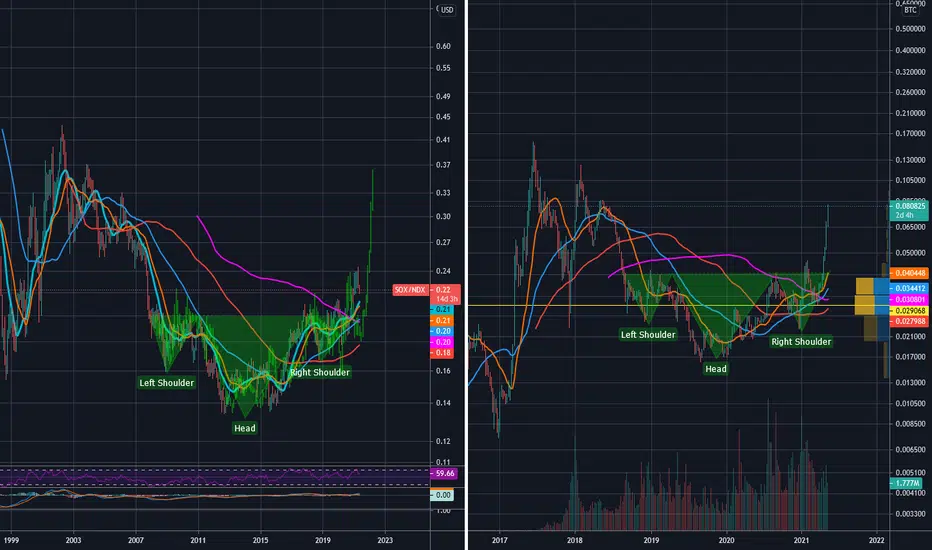
is $SOX to $NDX the $ETH to $BTC?Interesting comparison in performance of SOX to NDX and ETH to BTC. both have formed an inverse head and shoulders patterns, eth/btc has broken out while SOX/NDX seem to be following the same pattern but just have not broken out yet.
Don’t Forget About the ChipsThe Nasdaq is trying to stabilize, which could draw buyers back to semiconductors.
Chip stocks like NXP Semiconductors, Broadcom and Lam Research were some of the biggest gainers in the Nasdaq-100 last week. That helped push NDX ahead of the S&P 500 for the first time in five weeks. The relative strength also came amid two positive weeks for the Philadelphia Semiconductor Index.
The SOX chart above shows our Smart Relative Strength script with a 10-day interval.
This chart highlights underperformance in the broader SPDR Technology ETF in the same period:
This is noteworthy for two reasons. First, almost every chip company reported strong numbers last earnings season. Second, semiconductors are highly cyclical. Unlike high-multiple software stocks, they stand to benefit from the economy reopening. That’s especially important at a time when investors are unloading expensive growth stocks like Zoom Video Communications (ZM).
In addition to rebounding more quickly than other big tech names, SOX is now battling a downward-sloping trend line that began in mid-February. Traders may look for a breakout if the broader Nasdaq stabilizes or bounces in coming sessions.
TradeStation is a pioneer in the trading industry, providing access to stocks, options, futures and cryptocurrencies. See our Overview for more.


tick TICK TICK BOOM CHIP sector now setup start to move into a net short position cycles are bearish into feb 9 to march 10 on most everything

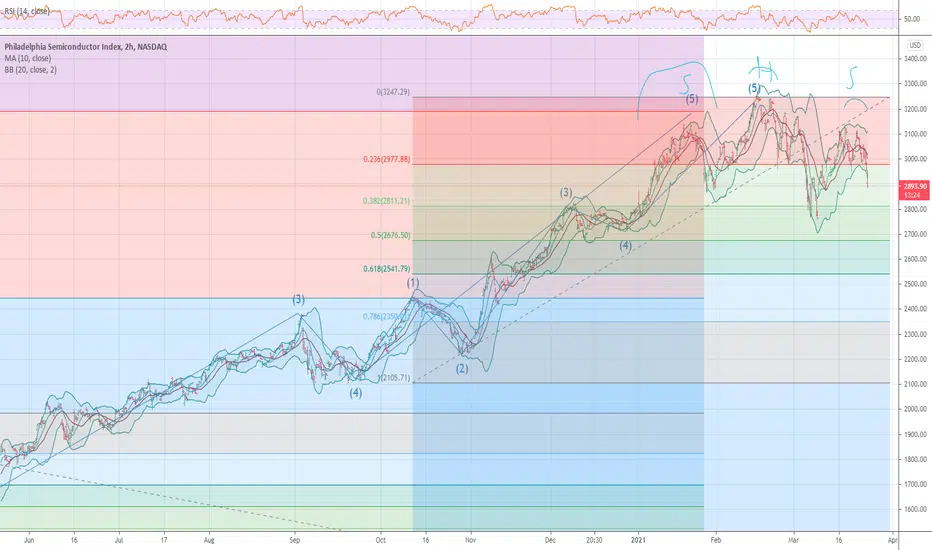
NEXT BUBBLE SOX 3200 POP We are now in the final days of this next Bubble . one by one has had a classic blowoff with most speaking of a NEW PARADINE and that we are in a NEW BULL MARKET QUOTE !! BASED ON THE DATA WE ARE AT THE 12 HR with a count down nearing the ZERO HOUR ! I am stating this as a very clear bubble near its end of Debt based money Velocity

Chips Bouncing at the 50-day SMASemiconductors are behaving more bullishly than the rest of the technology sector.
First, the Philadelphia Semiconductor Index made a higher high in mid-October. Meanwhile, the SPDR Technology ETF and Nasdaq-100 made lower highs.
Second, SOX pulled back to hold its 50-day simple moving average (SMA) while XLK and NDX sank all the way to their 100-day SMAs.
Additionally, SOX has been holding support at the same 2132 area where we flagged the channel breakout in late September.
Chips also have sentiment in their favor as investors swing back toward cyclical stocks like industrials and financials (the “reopening”/”stimulus” trade). We already got a taste of that with yesterday’s strong ISM manufacturing index. (China’s Caixin showed a similarly powerful industrial rebound.)
This trend could drive capital back to semiconductors, which are more economically sensitive. The industry also has secular tailwinds like 5G rollouts and cloud computing.
TradeStation is a pioneer in the trading industry, providing access to stocks, options, futures and cryptocurrencies. See our Overview for more.

SOX broke trend line
at the same time, SOX daily chart showing ADX twin peaks (negative divergence) and RSI divergence.
Disclaimer, this is only for entertainment and education purposes and doesn't serve by any means as a buy or sell recommendation.
Personally I hold both long term long positions and occasionally short term short position, for disclosure purpose.


Channel Breakout in the Chips?The Philadelphia Semiconductor Index formed an interesting pattern this month as the market pulled back. It initially dove toward 2100, and then managed to hold that level even as the Nasdaq-100 and S&P 500 proceeded to make lower lows.
Not surprisingly, that relative strength led to more bullishness this week as SOX jumped above its 50-day simple moving average (SMA) on Monday. It’s also fought its way into the large bearish candle from September 3, while NDX is only back to its September 10 range and SPX remains around its September 16 close.
The key pattern we want to highlight today is the sideways channel in SOX between September 4-25 because we’re now seeing a breakout above that consolidation range. This may create the potential for chips to lead other tech stocks. We could even see an accelerated move if SOX retraces the fast price action from September 3.
TradeStation is a pioneer in the trading industry, providing access to stocks, options, futures and cryptocurrencies. See our Overview for more.

Chip Stocks and Industrials Are Moving TogetherMarket correlations are always interesting because they can reveal how investors are thinking.
One correlation recently been similar movement between semiconductors and industrials. (This chart shows the 10-day correlation between the Philadelphia Semiconductor Index and the SPDR Industrial ETF .)
This isn’t a huge surprise because both are relatively cyclical. Stronger GDP growth tends to favor industrial equipment. It also boosts demand for chips.
On the other hand, software companies have benefited from the coronavirus lockdown for two reasons. First, more social distancing means more demand for cloud computing and videoconferencing. Second, weaker economic growth keeps interest rates low, which makes it easier to own high-multiple software names like Zoom Video Communications or Salesforce.com .
Industrial stocks outperformed in mid-September before crashing along with the S&P 500 last week. They’re trying to lead again today and chip stocks have pushed to their highs in sympathy.
Meanwhile ETFs tracking software like IGV and CLOU have bled lower since the open.
Traders may want to keep an eye on this pattern given the potential catalysts this week. Congress may pass a coronavirus-stimulus bill. We also have ADP’s private-sector payrolls report on Wednesday, ISM’s manufacturing report on Thursday and non-farm payrolls on Friday.
TradeStation is a pioneer in the trading industry, providing access to stocks, options, futures and cryptocurrencies. See our Overview for more.

SOX - Semiconductors might correct soonInsane what we saw for a rally since March 2020. Especially the TechSector and Semiconductors reach now a level which is crazy and not healthy. If you now invest in the broader market you hope that you´r not the last one who bought into the rallye. It´s time for a correction, so new money can flow into the market.
Watch out and take care of your Risk and Money Management.

SOX AND ALL CHIP MAKERS MAJOR TOP MOVE TO A NET SHORT 33/45% CYCLES ARE RUNNING OUT INTO A PEAK AUG 25 TO SEPT 4 /9 LOOK FOR A MAJOR BEAR PHASE CYCLES NOW INTO OCT 10 /20 A DROP OF OVER 30 % IS NEARING THE CHIP SECTOR
Sell semiconductorPhiladelphia Semiconductor Index has approached the ceiling of trend channel
Sell Semiconductor

Cup and handleI see a cup and handle/Gap ups at1513 ish that is not filled..but a gapd down close by previously
Leveraged semicondoctors..I think they will do well in the near future and I am in a few
I am not in this one/so not recommending it!
Go with your gut/and your wallet (o:

Philadelphia Semiconductor Index Tries for a BreakoutSoftware and e-commerce have mostly led the rally in technology and the Nasdaq. But now chips are trying to participate as earnings season approaches.
The Philadelphia Semiconductor Index broke out to new highs on Monday and has held its ground since. That may draw buyers who wanted more of a pullback but never got it.
This chart also features our Smart Relative Strength script, comparing SOX to the SPDR Technology ETF . It shows SOX has started outperforming the broader tech sector for the first time in about a month. Its breakout above 2,000 can now potentially serve as risk-management line for momentum followers.
The fundamental backdrop may support this rotation because chips stand to benefit from BOTH secular tailwinds and a cyclical recovery. Secular tailwinds include the ongoing shift to cloud computing, artificial intelligence and 5G networking. The cyclical recovery would come from global economies reopening from coronavirus. This creates a potential win-win setup for chips.
On the flip side, other recent movers like Zoom Video Communications and Netflix may become a source of funds if the macro environment improves.
The news flow has also been positive for SOX. Micron Technologies reported strong earnings last week and CEO Sanjay Mehrotra spoke of “healthy demand” in the second half of the year. Samsung beat estimates on Tuesday.
More results are coming soon. Chip-equipment giant ASML (#4 holding in SOX) reports on July 15, followed the next day by Taiwan Semiconductor . These aren’t as actively traded in the U.S. as names like Nvidia and Advanced Micro Devices , but they’re still important in the global industry. Intel ’s due the following week.

