SOXX going upStochastic oscillator and heiken ashi already indicate a turn around from a bottom (March 20). The index typically bullish, pulling back to fibbonacci levels. Same fibbonacci retracement shows the next level (much higher).
SOXX trade ideas

$SOXX SEMI CONDUCTOR STRENGHT WILL NOT BE DENIEDI like the setup I am seeing for resolution to the upside for semi-conductors here. I do have one concern but I'll address that shortly.
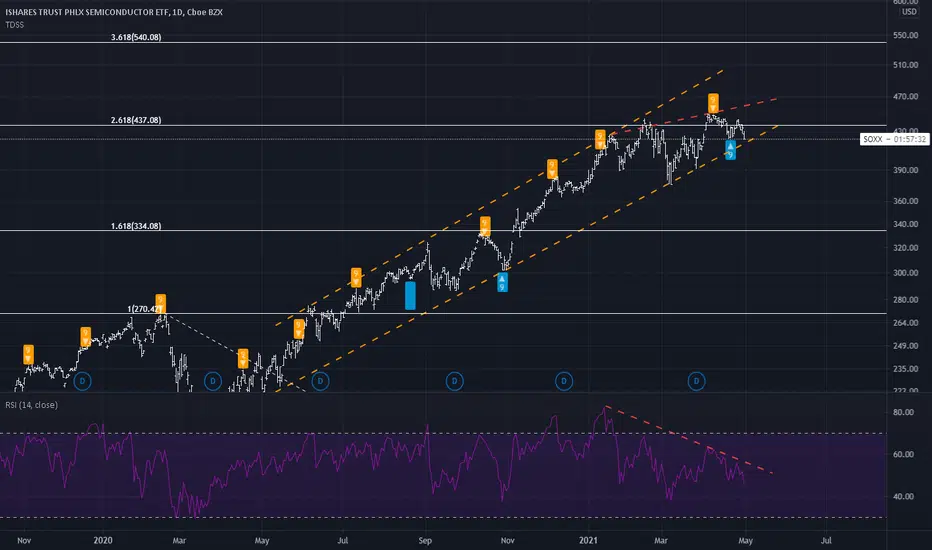
On the left is a weekly candle chart of SOXX the iShares semi-conductor ETF. The upward trendline from the covid-crash trough is firmly intact. The 100 Day EMA has proven to be key support. The index started consolidating the second week of November after a 10% move up the previous week. The index has been in that consolidation period ever since - perfectly normal and healthy. During the consolidation phase a support level around $516 has been established. What I don't like are the upper wicks on the candles during this consolidation phase. It shows that prices have not been able to breakout to the upside despite trying to push higher. If your looking for an entry, either a level down closer to support or a close above the upper wicks would be a better spot then where the index currently sits.
I do believe that the current evidence points to a breakout of the consolidation. Here's my case:
1) The long term uptrend is firmly intact.
2) Consolidations are continuation patterns.
3) Relative strength to the broader index (soxx/spy) is testing a breakout level after forming a deep base that goes back nearly a year.
4) After a tough chop-filled week in the markets XLK showed relative strength to SPY on Friday's close. The majority of the names in the XLK that outperformed it's sector were semi-conductor names.
5) XLK/SPY showed a move higher before getting to previous support - relative strength improving due to semi-conductor names in the XLK.
Links to my watchlists:
SPY Sectors - www.tradingview.com
XLK Holdings - www.tradingview.com
SOXX Holdings - www.tradingview.com
Toggle by change% and everything above the index ticker outperformed for the day.

Semiconductors at long-term supportWhen looking at a weekly chart, it is easier to see if an asset is in a bullish or bearish trend.
Taking a look a the SOXX, we see we are at a potential place for a bounce.
I chose the 52 exponential-moving average because there are 52 weeks in a year, and it has worked very well in the past.
A close on a weekly basis below this level is the signal to get out. If we can hold though, it would be a strong bull case for a bottom.

Semiconductor short I'm forever blowing bubbles,
Pretty bubbles in the air,
They fly so high, nearly reach the sky,
Then like my dreams they fade and die.
Fortune's always hiding,
I've looked everywhere,
I'm forever blowing bubbles,
Pretty bubbles in the air.
shh JPOW
Disclaimer: post for information only; no advice or fks given
TA: Bear div, broken parabolic trend line
FA: Transitory
Caution: can stay irrational longer than sheeple can stay solvent

Semiconductor shortBearish rising wedge daily chart has broken down recently and back testing the trend line. Objective short entrance. Negative divergent continue to grow on both RSI and PPO.

Semi's are showing exhaustionSemiconductors reached peak bulltard due to shortages. The uptrend started back in 2013 and was barely affected by covid. At the peak it was 40% above the weekly kijun. Interesting to see what happens. The next big short or just an expected correction?

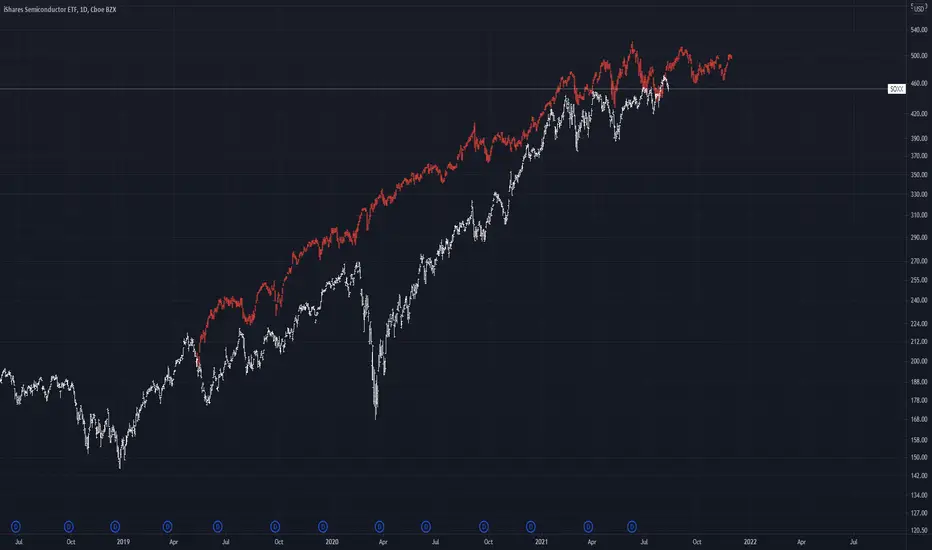
SOXX 1 year trendSemiconductors/chips continue to be an essential part of everything around the globe.
For a year, we have maintained an upward trend, which is being tested today.
There are clear outperformers in the industry, but it is clearly been working for all of them as a whole.
When we have touched the trend line in the past, we have had a 50 point gain, which has happened through 2 weeks approximately. That gives us a target of around $505.

SOXX UpdateHas a decent gap to fill. Usually shortable above upper trendline. In NVDA puts, may add AMAT puts.

SOXX DailySOXX, the range bound sucker that won't die. This thing has a long ways to go if a correction comes. Short AMAT or NVDA.


Semis OverviewThe two overcrowded trades of 2021 are financials and Semis. May pick up AMAT shorts sometime soon.


When the Party at SOXS is too goodThe party at SOXS is never that good. But sometimes things come together. As you can see when everyone has arrived it is time to leave and move the party back to SOXX.

SOXX Bearish DivergenceOne word: SAD.
Buyers need to come in and push the price higher, otherwise we're looking at a double top situation.


This True Range Algorithm is Signaling a Short Term PullbackOn average a position was held about 7 trading days. Check out the strategy results below for detailed statistics.

Zoltar says: SOXX come to daddyAlmost in the buy zone (box). Might start adding some tomorrow if decline continues.

Semiconductor sector (SOXX) seem ready to turn its trendSemiconductor sector seems ready for a trend change. Since the March low, the sector has ran up more than triple digit percentage. As much as the sector is damaged less than retail and hospitality, it is very cyclical sector and it does get affected by business cycle. Semi is the canary in a coal mine of the tech sector (XLK), so when this turns, it will be a headwind for the entire tech sector as a whole. When the tech breaks, the market breaks for its heavy weight on the indexes.
Recently broke the minor yellow up trend line and reversing right at the long term trend line since last spring.
Initial target is the bottom of the trading range. $404ish depending on when it hits it.
2nd target is the horizontal support right below the channel. $384.46
As how bullish the overall sentiment is in the market recently, once it turns, it will be pretty quick move downward. Potential long term targets are listed but SOXX will not going to fall double digit without if XLK and indexes are resilient.
Only the time will tell but it will be prudent and be cautious. Scaling down on aggressiveness won't be a bad idea and have some hedges.
Have a good trade everyone,
T.

Semiconductors is way overpricedCorrection in semicoductors started. There are options, depending on market
