SPWR trade ideas

$SPWR Target 43.85 for 21.40% $SPWR Target 43.85 for 21.40%
Or next add at 28.39
I am not your financial advisor. My trade set ups work very well and they are for my personal reference and if you decide to trade them you do so at your own risk.
GL

SUNPOWER Possible Breakout on 1M ChartIf you follow my last #analysis from July,2020 about #SUNPOWER Inc. , there was a Golden cross of 21d MA and 50d MA. That was the reason, I was very positive about its uptrend.
Of course, only chart and Golden cross wouldn't be enough for a company to give good ROI for investors. #Sunpower has at the moment a notable amount of long-term and short-term loan.
But, the company has also gained some big companies ( #Toyota,# Macys, #FedEx ) as new partners for #sustainable #greenenergy
If #sunpower breaks the upper channel then the next price target could be around 50$-55$ .
*** Just sharing my own opinion , NOT AN #INVESTMENT #ADVICE.

SPWR smack in the middle of BUY ZONEPatience pays, and in this case by giving us an entry smack in the middle of the BUY ZONE:

SPWRNot a buy recommendation yet, just a demonstration. I would never chart all these lines, but I drew out lines that rejected price at least two times each— NOTE how future price reacted to those lines. The trend lines are real people!

The Tipping PointHere's a little trade set up on another, mostly, penny stock. NASDAQ:SPWR is bouncing off the bottom of a long-running bullish channel. Within this channel, 2 symmetric triangle patterns are in development.
Our price is closing in on the apex of the first symmetric triangle in a matter of days, and at the same time, we have developed Class A Hidden Bullish Divergence on our oscillators.
In contrast, however, if you look at the first triangle within the larger context of the potential second triangle, what it has also formed is a partial rise, or a pattern of distribution that would indicate a 70% chance that the price action will fail to hold support at the demand line and break out of the larger symmetric triangle downward. If this comes to pass, the measured move of the triangle pattern would indicate a retrace to $5.85, or a roughly 80% correction. Note, however, the chances of this occurring are mitigated by the Class A hidden bullish divergence.
If the price action recovers and breaks out to the upside of the first triangle, the measured move of that would imply it would break out upward of the second, larger symmetric triangle. The same measured move used to predict the bearish price point 'could' be pointing us to a return to a previous historical support/resistance of $65.35, though this is a bit of a projection since we don't know exactly where the price would break out (though, on symmetric triangle, the breakout occurs most often 60% of the way to its apex, which roughly lines up with where I have it plotted on this chart).
With all of the data above plotted, I've planned a total of five, count em, 5 whole take profit levels. Some of them are set just below historical support/resistances, while others are placed at fib nodes and extensions (which I don't have plotted here because it would have made the chart too chaotic to look at). Rest assured, however, they are all very informed guesses on where the price could go if this trend continues.
If the price breaks out bearishly to the downside of these triangles, however, you could expect our large 80% movement down as well ... so to give our trade a little bit of wiggle room, our stop loss will be be set to $20, just a few cents below a historical support. If it fails to hold that, then its certainly not a false break out downward, and we would be better off waiting for another opportunity. However, this large stop would require us to risk 36% of our position. This is still nearly a 3 to 1 risk/reward ratio on even our first take profit level, however. This should be unsurprising. High reward set ups on high risk trades will come with high price tags if they fail.

Sun Power $SPWR to complete Head & Shoulders? LONGSun Power has had a rough go w/ the overall market struggling, but it should be close to reaching a strong support point with previous lows looming. The maroon-circled region represents an area of excellent entry, with the trace down further being somewhat dubious.
Patience can be exercised here a little. The corrective wave is happening, but we cannot rule out a trace down to 31/s. That is fully possible. While there's little fault to be found with entering right now (circa 10:30 AM EST), there possibly may open up an even lower buy point.
Regardless of whether it does or not, this stock should have no problem ascending back to its previous levels as the market normalizes. A target sell-point can be tenatively scheduled between 41 and 44 per share; with that maybe being a 1/2 exit. For this moment? We find that entry point!
BEST OF IT ALL!
-BDR

SPWR enters BUY ZONESPWR after huge move, makes a classic ABC correction and enters BUY ZONE. Offers a 2.5 to 1 risk reward if entered here with a target at previous high (before ABC correction). Would like to see divergent RSI and MACD before entering...


SPWRSunPower Inc. is up nearly 2,000% since March and continues to grow. The paper differs in that growth is constantly accompanied by the formation of trend continuation patterns, which speaks of organic fundamental growth, and not just hype. At the moment, after a slight correction, an oblique triangle pattern has been formed and its breakout has occurred (see the upper yellow circle). Now 3 targets are expected to be achieved - 57.20, 63.54 and 67.47 (total growth of 61%). Due to the high volatility, there is a decent IV on the options board of 125%, which will allow this trade and options to be traded, which will benefit from more than just going long and buying the stock.

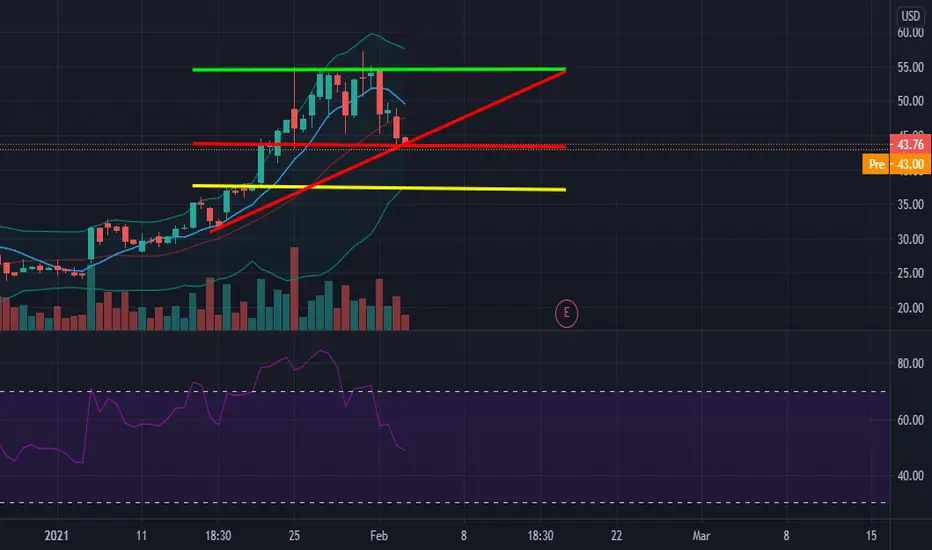
Break out Spwr51.50 is entry
50.00 stop loss
white lines original channel
redlines new uptrend channel
yellow line breakout confirmation
greenlines target
earnings this week

SPWR Short ChartThis is my first chart so take it with a grain of salt...
Also, if anyone who has been charting for much longer has any suggestions, lemme know

SUN Power! Where he go!?I think for short term he will go around 40, if he break resistence will go max to 37 dolars! From E are 2 posibilites, will go up with suport line around 55 or will go down to 30!
Short term good entry point 40.
Med term good entry point 30/40
Long term more less than 30.
A good potential for future but now he was to shorted!
This its not a financial advice its just my opinion!
Good look to everyone!
Breakout on SPWR??We're on an uptrend. Are we breaking out, or still stuck in a range?
I seen somewhere on a news article saying that SPWR was fully valued, and if that's the case we can possibly see a continued range. I will publish another in depth analysis on a smaller timeframe at the point of resistance. Now if there were any good bullish news released anytime this week, this would most likely be a breakout. I know that the more times price tests a major structure level, it signals a strong breakout to the upside or downside

SPWR: Bullish FlagBullish Flag
Pros:
Descending volume during formation
PPS above 50MA and 200MA
RS above 0, and ascending
ATR Ascending
R/R ratio above 7
200MA ascending
250RSI above 50
If confirmed:
PT = 83.29$

SPWR BUYSPWR has been riding like a BULL. I notice that We rejected ATH at 54.88. I then realized there was a huge slide down like every other stock. I noticed that there is ample opportunity as this dip closed bullish on the hour, 15 and 5 min. I am sitting on a break above the 1.618. It closed directly at the 1618 and I am expecting a close above, consolidation as retest then move forward. If it breaks below and engulfs Id look to see what EMAS look like on lower time frames and then daily engulf at the end of the day to determine if it is a good swing to hold.
Confirmations on Monthly
• Proper accumulation and distributions set up.
• Huge push up and break above retest of nose of nose
Close and hold above that Nose on higher time frame.
As you zoom in, You notice SPWR rejected off that previous broken resistance.
Confirmations: Weekly
• Huge candle on weekly
• Proper retracement to previous level (broken resistance)
• Rejection off of the next zone in confluence with the 1.618.
Huge wick on dip and at recent highs.
Things to look for:
• Have to make sure this candle closes above at 9:30 am.
It is possible there can still be some selling pressure
Now, as I zoom in I realize that although volatility was there today, The big dip was bought at monthly zone from previous levels.
Confirmations: Daily
• Wick off of previous zone
• Big rejection at level
Closed above previous weekly highs(meaning buyers are still in buying DIP
Now, on the smaller time frame I spotted a reverse head and shoulders, same set up we had on the left side before shooting up really well.
Confirmations: 15 min
• It closed above previous WH.
• Held EMAs which are holding overall market trend
• Possibility of revisiting recent time highs.
Look for profit target at 50 dollars.


Sunpower: extremely bullish
Sunpower is doing things well technically. It just got the 32.67$ goal and now it is in free rise. It is expected that it corrects its trend but there is no reason to think that this stock could turn in a bearish trend (at least technically speaking9.


interesting SPWR possibilityspwr retraced 61.8% of recent wave, and then formed a cup and handle while fulfilling the 50% retracement. mar 19 33C

ATR too steep. But, in clear uptrendLooks to be clear uptrend. But, ATR at present is too steep which leads to requirement of wider stops. Clear support lines at 20 and 24. Clear long if price closes above previous Higher high

BUY to SUNPOWER CORP Hey traders, SUNPOWER CORP is in a bearish fake composition with an upside down hammer candle and an explosion in past purchase volume. By zooming in on the TIMEFRAME M1 we see a water carrier candle with a large volume of purchase issued, it is coming to test the base of the bollinger. And go from the top of it for a new test to go to the VWAP and go to the top of the comfort zone to test it. Strong propability to breakout the price with momentum at the same time the zone reaching another. And join the next highest followed by a test from the top of the zone to continue breakout on the top of the bullish channel.
Please LIKE & FOLLOW, thank you!
