SSYS trade ideas
SSYS, Mega bullish BATSSYS, Mega bullish BAT.
only issue is: how long will it take to reach target 1? willing to wait for multiple months?


Stratasys - ShortSSYS is a company from the 3D printing industry. It has been in an aggressive downtrend, losing more than 80% of its value since it topped out in 2014.
Looking at the weekly chart, I believe the stock has not bottomed yet. Price is at value after a class A bullish divergence, while the Force Index is oversold.
The daily chart shows a nice double top with a bearish divergence on the MACD lines, histogram and Force index. A text book shooting star candle made a false breakout at the double top.
If this won't prove to be a V shaped bottom, we should see this stock around 15$ again.

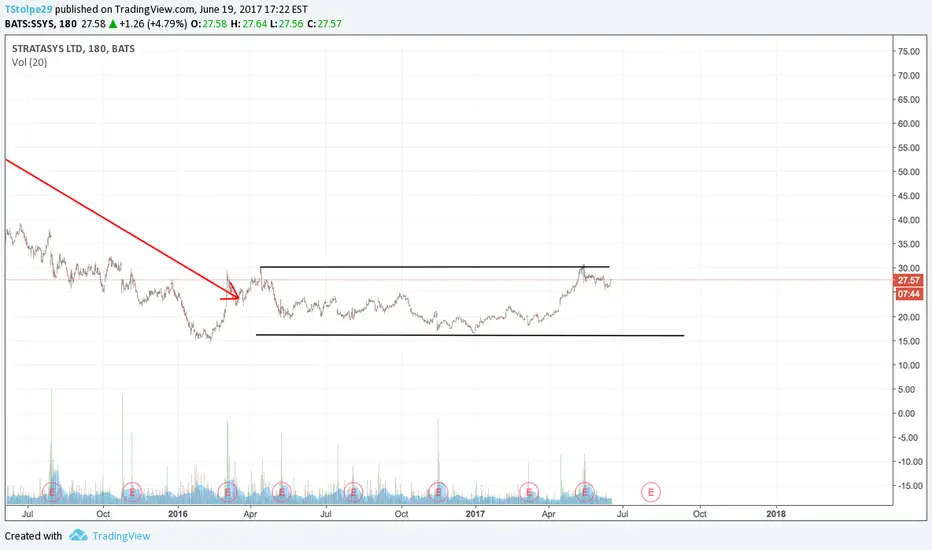
ssys has returned to its long term pasteif you have the time. say 10 years :-) it can retrace all lost value. remember nasdaq 2000 highs and today highs.... thats what bubbles do. now all you need is patiance.
in weekly and daily looks interesting right here and now

$SSYS: perfectly formed IH&S patternBreakout is pending on this perfectly formed IH&S pattern which targets the $38/$40 area.


SSYSFor gigles. Hard to tell if PINK or YELLOW is is play. Targets verry different, so look to pink first

Stratasys - Short with the trendThe weekly Wave has turned down, and price is rallying to value. Weekly picture here :
The daily shows a very nice pattern. Everytime price returns to the wave, it's ready to continue going down. Usually I use the MACD, but hidden divergences are easier to spot on stochastic or RSI. Hidden divergences confirm the prevailing trend. I want to see a close below 92 to confirm this chart.
My brokers don't offer Stratasys, they offer its competitor DDD, but I got my butt burned on that one. This is a paper trade.

SSYS break up of descending channelThis 3D printing stock was very hot during 2012 and 2013 but lost its luster in 2014 as investors are looking for major cap companies who pay high dividends. Even the leader 3D Systems pulled back 50% from its highs which tells us that price is very unstable and speculative in this revolutional sector.
Stock broke up descending channel at $90-$92 with ignited bull candle and regained some moving averages. I like idea playing cautch up here. Stop for active swing traders could be below $92. Entry above previous high at $95.85 with target at $105 where 200EMA sits.


SSYS about to Squeeze??Strong potential for a steep climb into the year's End. Some abvious areas of resistence ahead but we could see a 130+ by end of next week.


Upside to SSYS?Long(er) than vs short because of a new support line and upside strength. Looking for breakout above triangle to 120.

