Trade Setup Breakdown for SWIM (30-Min Chart)!📊
🔹 Stock: SWIM (NASDAQ)
🔹 Timeframe: 30-Min Chart
🔹 Setup Type: Symmetrical Triangle Breakout
🚀 Trade Plan:
✅ Entry Zone: $6.56 - $6.60 (Breakout Confirmation)
✅ Stop-Loss (SL): $6.39 (Below Key Support)
🎯 Take Profit Targets:
📌 TP1: $6.76 (First Resistance)
📌 TP2: $7.00 (Extended Target)
📊 Risk-Reward Ratio Calculation:
📉 Risk (Stop-Loss Distance):
$6.56 - $6.39 = $0.17
📈 Reward to TP1:
$6.76 - $6.56 = $0.20
💰 Risk-Reward Ratio to TP1: 1:1.2
📈 Reward to TP2:
$7.00 - $6.56 = $0.44
💰 Risk-Reward Ratio to TP2: 1:2.5
🔍 Technical Analysis & Strategy:
📌 Breakout Confirmation: Price moving above $6.60 with increasing volume.
📌 Pattern Formation: Symmetrical Triangle Breakout, signaling a potential bullish move.
📊 Key Support & Resistance Levels:
🟢 $6.39 (Support / SL Level)
🟢 $6.56 - $6.60 (Breakout Zone)
🟢 $6.76 (First Profit Target / Resistance)
🟢 $7.00 (Final Target for Momentum Extension)
🚀 Momentum Shift Expected:
If the price sustains above $6.60, we could see an upside rally towards $6.76 and $7.00.
🔥 Trade Execution & Risk Management:
📊 Volume Confirmation: Ensure strong buying volume above $6.60 before entering.
📈 Trailing Stop Strategy: If the price reaches TP1 ($6.76), move SL to $6.60 to protect profits.
💰 Partial Profit Booking Strategy:
✔ Take 50% at $6.76, let the rest run to $7.00.
✔ Adjust Stop-Loss to Break-even ($6.60) after TP1 is hit.
⚠️ Fake Breakout Risk:
If the price fails to hold above $6.56, be cautious and avoid entering early.
🚀 Final Thoughts:
✔ Bullish Breakout Setup – If price sustains above $6.60, a strong move is expected.
✔ Momentum Shift Possible – Volume increase will confirm the trend.
✔ Favorable Risk-Reward Ratio – 1:1.2 to TP1, 1:2.5 to TP2.
💡 Stick to the trade plan, manage risk, and trade smart! 🚀🏆
🔗 #StockMarket #SWIM #TradingSetup #TechnicalAnalysis #BreakoutTrade #DayTrading #MarketTrends #ProfittoPath
SWIM trade ideas

"SWIM: Double Bottom Breakout Signals 80% Return Potential!"SWIM Stock: Double Bottom Breakout Signals Potential 80% Returns in Producer Manufacturing Industry
SWIM stock, a prominent player in the producer manufacturing industry, is on the brink of a significant breakthrough as it forms a double bottom pattern. With the potential for a breakout back to $4.70, investors could see returns of up to 80%. While still in an accumulation phase, $4.70 is expected to act as a take-profit zone before a likely retracement for re-entry amid sideways movement. Let's explore the dynamics of SWIM stock and the opportunities it presents in the manufacturing sector.
Understanding SWIM Stock and Latham Group, Inc.
SWIM, or Latham Group, Inc., operates as a designer, manufacturer, and marketer of in-ground residential swimming pools in North America, Australia, and New Zealand. It offers a portfolio of pools and related products, including in-ground swimming pools, pool liners, and pool covers. The company was founded on December 6, 2018, and is headquartered in Latham, NY. With its strong focus on quality and innovation, Latham Group has established itself as a leader in the industry, catering to the needs of residential customers across multiple continents.
Anticipated Double Bottom Breakout
SWIM stock is currently exhibiting a double bottom pattern, a bullish technical formation that suggests a potential reversal of the downtrend. The breakout from this pattern could propel the stock back to $4.70, offering investors significant returns of up to 80%. This bullish outlook is supported by the current chart setup.
Strategic Accumulation Phase
Despite the potential for a breakout, SWIM stock remains in an accumulation phase, indicating ongoing investor interest and accumulation of shares at lower price levels. As the stock approaches $4.70, investors may consider strategically accumulating shares in anticipation of the breakout and subsequent price appreciation.
Take-Profit Zone and Retracement Strategy
While $4.70 is anticipated to serve as a key resistance level and take-profit zone, investors should exercise caution and consider scaling out of their positions to lock in profits. Following the take-profit zone, a retracement may occur, presenting an opportunity for re-entry as the stock consolidates sideways. Prudent investors may utilize this retracement to strategically add to their positions and capitalize on future price movements.
Conclusion: Capitalizing on Manufacturing Sector Opportunities
In conclusion, SWIM stock presents a compelling opportunity for investors in the producer manufacturing industry as it prepares for a potential double bottom breakout. With the potential for significant returns and strategic accumulation opportunities, investors should closely monitor SWIM stock's price action and consider deploying capital strategically to maximize returns in the dynamic manufacturing sector.

SWIM - Breaking OutSwim is positioned nicely to take advantage of the rise in interest rates as clients are moving away from the inflated prices of concrete swimming pools and downsizing to the speed and lower cost of fiberglass pools. They have made multiple moves to handle capacity issues they dealt with in the covid boom and will continue to see growth in the vinyl replacement & safety cover business. Not to mention we have a downtrend break out and it appears the bottom has been put in. The sky is the limit for this stock and there is no better season to get into a beat up pool stock than pre-summer. I see massive potential - Don't sleep on this one

1000% potential gain 1000% potential gain is what this stock can make to us only if goes back to ATH!
This crises will be history one day and now is the best moment to buy good companies at this price level.

3rd TestIt has just completed the 3rd bounce off a double bottom. In my experience this usually causes an accelerated move to the upside.

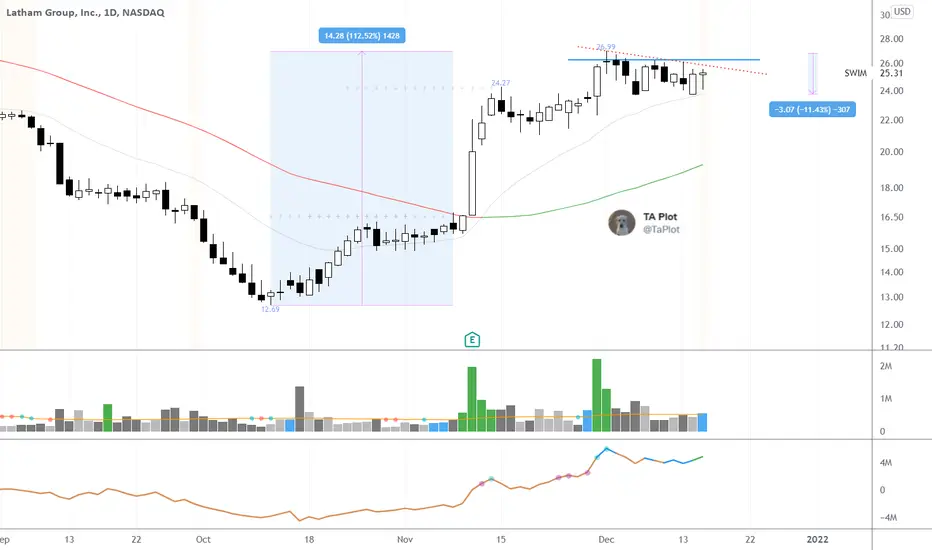
$SWIM Looks Very Strong$SWIM up 112% in short period of time and gave up less than 12% of that in a touch market.
That is strength.
Quite a few things coming together here. on Primary watchlist.

$SWIM Keep and eye on this one this week!Hey guys found a clean Gartley pattern in swim, I listed all triggers bc there is 3 in the Gartley pattern, 786 ext and 1.212 are both touched off, watch the lower level trigger 3 or abcd level which is still not hit, this can make a big move, I listed targets and stop loss as well, tp1 pls move stop to even & enjoy the free ride (if we get it) I will attach financials to review for dd, thanks for looking.

$SWI M is giving a GREAT IPO LONG opportunity todayIPO intraday trading strategy idea
Latham Group specializes in fiberglass residential in-ground swimming pools, which can be installed more quickly than an in-ground concrete pool.
The share price is rising and gonna continue this trend today.
The demand for shares of the company still looks higher than the supply.
These and other conditions can cause a rise in the share price today.
So I opened a long position from $24.98;
stop-loss — $23.22 ;
take-profit — 30.26/MOC price.
Do not view this idea as a recommendation for trading or investing. It is published only to introduce my own vision.
Always do your own analysis before making deals. When you use any materials, do not rely on blind trust.
You should remember that isolated deals do not give systematic profit, so trade/invest using a developed strategy.
If you like my content, you can subscribe to the news and receive my fresh ideas.
