TDUP Long Trade Setup – Ascending Triangle Breakout!📈
Pattern:
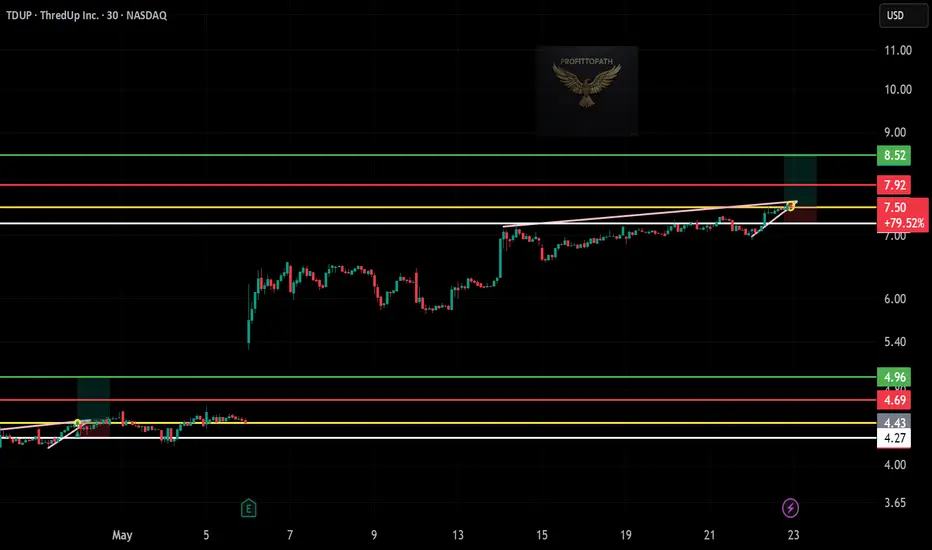
Ascending triangle with resistance at ~$7.50–$7.92, breakout candle in play.
🔍 Technical Setup
Entry: Around $7.50 (breakout zone)
Stop-Loss (SL): Just below yellow support trendline (~$7.20)
Target 1 (TP1): $7.92 (red resistance)
Target 2 (TP2): $8.52 (green resistance zone)
✅ Bias
Bullish above: $7.20
Caution below: $7.20 (fake breakout zone)
🔧 Key Highlights
Strong consolidation breakout after steady accumulation
Volume is relatively low, so watch for confirmation candle
Risk-to-reward looks favorable (1:2+)
TDUP trade ideas
TDUP – Long Trade Setup !📈 🟢
Ticker: ThredUp Inc. (NASDAQ: TDUP)
Chart: 30-Min Timeframe
Pattern: Ascending triangle breakout continuation
🔹 Entry: $4.44 (breakout above horizontal resistance + trendline support)
🔹 Stop-Loss: $4.17 (below ascending support)
🔹 Take Profits:
TP1: $4.69 – Resistance zone
TP2: $4.96 – Measured move breakout target
⚖️ Risk-Reward Calculation:
– Risk/Share: $0.27
– Reward to TP2: $0.52
– R:R Ratio: ~1:1.9 ✅
🧠 Technical Highlights:
– Bullish breakout from a tight ascending triangle
– Clean structure with higher lows and breakout candle
– Volume increase confirms buyer interest at breakout level

TDUP (NASDAQ) - 30-Min Chart Long Trade Setup! 🚀
🔍 Stock: TDUP (NASDAQ)
⏳ Timeframe: 30-Min Chart
📈 Setup Type: Bullish Breakout
📍 Trade Plan:
✅ Entry Zone: Above $2.64 - $2.67 (Breakout Confirmation)
🚀 Take Profit 1 (TP1): $2.78 (First Resistance)
🚀 Take Profit 2 (TP2): $2.92 (Extended Bullish Target)
🔻 Stop-Loss (SL): Below $2.51 (Key Support)
📊 Risk-Reward Ratio: Favorable for a bullish continuation 📈
🔹 Technical Analysis & Setup:
✅ Pattern: Ascending Triangle Breakout 📈
✅ Breakout Confirmation Needed: Price holding above $2.64 with volume support
✅ Resistance Zones:
$2.78: First Major Resistance
$2.92: Extended Target for strong momentum
✅ Momentum Shift Expected: A breakout could trigger a strong uptrend 🚀
🔥 Trade Strategy & Refinements:
📊 Volume Confirmation: Look for increasing buying volume above $2.64 📉
📉 Trailing Stop Strategy: Once price reaches TP1 ($2.78), adjust SL higher to secure profits 🛑
💰 Partial Profit Booking: Take partial profits at $2.78 and let the rest ride toward $2.92+ 💵
⚠️ Fake Breakout Risk: If price drops back below $2.64, reconsider entry ❌
🚀 Final Thoughts:
✅ Bullish Breakout Confirmed – High probability of continuation higher 📈
✅ Momentum Shift Possible – A move above $2.78 could accelerate the upside 🚀
✅ Strong Risk-Reward Setup – SL at $2.51, TP at $2.78 - $2.92 for optimal gains
📊 Trade Smart & Stick to the Plan! 🏆🔥
🔗 #LongTrade #StockTrading #TDUP #TechnicalAnalysis #DayTrading #MomentumTrading #BreakoutSetup #RiskReward #TradingPlan #ProfittoPath 🚀📈

THREDUP Stock Chart Fibonacci Analysis 020924 Trading Idea
1) Find a FIBO slingshot
2) Check FIBO 61.80% level
3) Entry Point > 2/61.80%
Chart time frame : D
A) 15 min(1W-3M)
B) 1 hr(3M-6M)
C) 4 hr(6M-1year)
D) 1 day(1-3years)
Stock progress : C
A) Keep rising over 61.80% resistance
B) 61.80% resistance
C) Hit the bottom
D) Hit the top
Stocks rise as they rise from support and fall from resistance. Our goal is to find a low support point and enter. It can be referred to as buying at the pullback point. The pullback point can be found with a Fibonacci extension of 61.80%. This is a step to find entry level. 1) Find a triangle (Fibonacci Speed Fan Line) that connects the high (resistance) and low (support) points of the stock in progress, where it is continuously expressed as a Slingshot, 2) and create a Fibonacci extension level for the first rising wave from the start point of slingshot pattern.
When the current price goes over 61.80% level , that can be a good entry point, especially if the SMA 100 and 200 curves are gathered together at 61.80%, it is a very good entry point.
As a great help, tradingview provide these Fibonacci speed fan lines and extension levels with ease. So if you use the Fibonacci fan line, the extension level, and the SMA 100/200 curve well, you can find an entry point for the stock market. At least you have to enter at this low point to avoid trading failure, and if you are skilled at entering this low point, with fibonacci6180 technique, your reading skill to chart will be greatly improved.
If you want to do day trading, please set the time frame to 5 minutes or 15 minutes, and you will see many of the low point of rising stocks.
If want to prefer long term range trading, you can set the time frame to 1 hr or 1 day.

