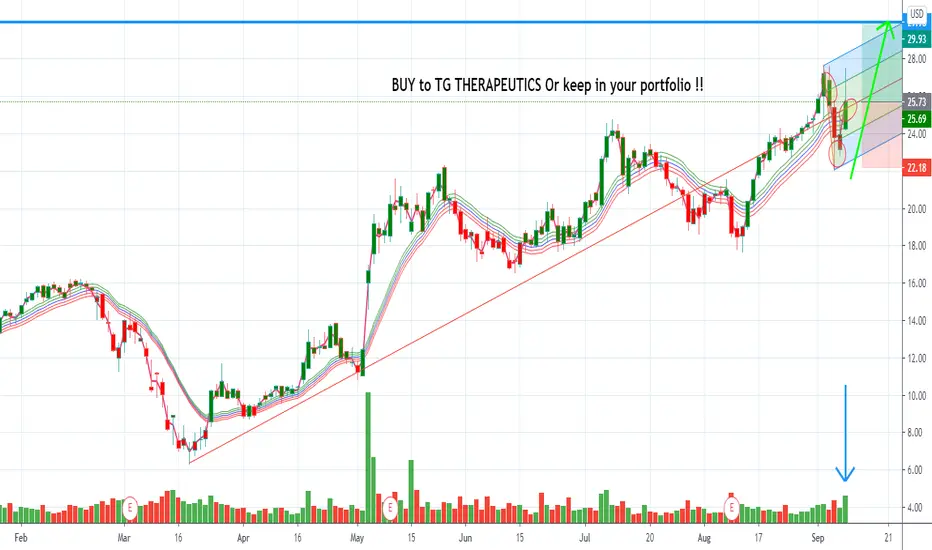
TGTX is Bull. Entering Trend Channel (after Elliot Wave)TGTX is Bull and it is entering the Trend Channel. It made an Elliot Wave, and it is rebounding to the trend. Its growth will also be fueled by XBI which is also bullish.
TGTX trade ideas

Elliot Wave (Failed Breakout) creates long-term growth potentialTGTX made an Elliot Wave but it failed to continue the trend after the Correction Wave and it collapsed.
However, The Elliot Impulse Wave did create potential for TGTX because it built up a good Trend Channel.
To continue to grow, it would need to enter Trend Channel first and then stabilize within it.
The green dotted line is where it needs to go.
Note: This is for Educational Purposes Only.


Trend Reversal Confluencing Signals.Confluencing trend reversal signals as described in 'Price Action Breakdown'.
I have yet to effectively apply the reading. Still trying to make sense of it. using it only when appropriate. that sort of thing.

Buliish MACD divergence on 1D $TGTXGetting into long position with TGTX. Aslo suits for long term investment

this is what i like to seei think TGTX has an FDA approval coming up and a great cup and handle it can break out of
im excited to see the price action on this on be patient with the entry
good luck!
if anyone knows lmk when the FDA approval is

TGTX possibly breaking out of a long basing formationAfter failing to follow through on the 02/05 breakout, were now back at the 50ma with a gap fill along with decreasing volume. I think this is a hit or a miss, it'll most likely bounce strongly and make new highs or continue grinding down through the 50ma.


TGTX, enters Downtrend as Momentum drops below 0 level on Jan 14This indicator may be signaling that TGTX's price has further to drop, since it fell below its price logged 14 days ago. Traders may consider selling the stock, shorting the stock, or exploring put options. Tickeron's A.I.dvisor backtested 83 similar cases where TGTX's Momentum Indicator fell below the 0 level, and 71 of them led to a successful outcome. Odds of Success: 86%. Current price $50.00 is above $29.61 the highest resistance line found by Tickeron A.I. Throughout the month of 12/11/20 - 01/14/21, the price experienced a +21% Uptrend, while the week of 01/07/21 - 01/14/21 shows a -5% Downtrend.
Bearish Trend Analysis
The 10-day RSI Indicator for TGTX moved out of overbought territory on January 11, 2021. This could be a bearish sign for the stock. Traders may want to consider selling the stock or buying put options. Tickeron's A.I.dvisor looked at 35 similar instances where the indicator moved out of overbought territory. In 27 of the 35 cases, the stock moved lower in the following days. This puts the odds of a move lower at 77%.
The Momentum Indicator moved below the 0 level on January 14, 2021. You may want to consider selling the stock, shorting the stock, or exploring put options on TGTX as a result. In 71 of 83 cases where the Momentum Indicator fell below 0, the stock fell further within the subsequent month. The odds of a continued downward trend are 86%.
The Moving Average Convergence Divergence Histogram (MACD) for TGTX turned negative on December 31, 2020. This could be a sign that the stock is set to turn lower in the coming weeks. Traders may want to sell the stock or buy put options. Tickeron's A.I.dvisor looked at 43 similar instances when the indicator turned negative. In 37 of the 43 cases the stock turned lower in the days that followed. This puts the odds of success at 86%.
Following a 3-day decline, the stock is projected to fall further. Considering past instances where TGTX declined for three days, the price rose further in 50 of 62 cases within the following month. The odds of a continued downward trend are 84%.


TG Therapeutics Announces Positive Topline Results from the ULTITGTX: TG Therapeutics, Inc.
2020-12-10 07:11:33
TG Therapeutics Announces Positive Topline Results from the ULTIMATE I & II Phase 3 Studies Evaluating Ublituximab Monotherapy for the Treatment of Patients with Multiple Sclerosis

BREAKOUT CUP WITH HANDLE AND HIGH VOLUM BUY TGTX ABOUT 43.50$TG Therapeutics Soars on Positive Results for MS Treatment
TG Therapeutics (TGTX) - Get Report soared Thursday after the biopharma announced positive results from two global Phase 3 studies, evaluating ublituximab, the company's treatment of multiple sclerosis patients.
Shares of the New York-based company were skyrocketing nearly 42% to $42.04 in trading Thursday.
1% CAPITAL

TGTX Retest of Lower Main Bull Trend Line? I have a position in TGTX with a tight stop loss for a Continuation to the Upside. It was in a Wedge Pattern that ended up breaking down to the 50MA today on the daily chart. Unfortunately, I would love to have gotten in at that position; However, I believe the bullish trend is still in tact. I did notice a nice spike in volume today, at 15:30 today, which ended up pushing the stock closing above the 30 Min 15MA. I still do not like the upper Fractal Wicks being long on the 30 Minute Time Frame, showing strong selling pressure. I will be monitoring this one daily to see a daily close above what I believe is the primary bullish trend.

TGTX Swing trade for the next couple weeksFriday´s session price broke the weekly trend line with a huge volume and also above the 21 exponential moving average

BUY to TG THERAPEUTICS DailyHey my friends,TG THERAPEUTICS is in a fake bearish pattern with high buying volume and there is a large bearish shadow buying from sellers. We see a cross on the TIMEFRAME 1 Min which means that the title is still trying to go up. Strong likelihood of going to the 3rd highest which is above the last strong increase is a 2012 level in full fall.
Please LIKE & FOLLOW, thank you!
Will we bounce off of the 200ema?Today wasn't what I expected. We ended the day right at the 200 ema mark. I'm concerned if it will bounce off the ema Monday morning or dip past the ema. Best case scenario we work our way back up to wave 3. Any opinions, let me know!

Wave theory practice.I'm just trying to practice my wave theory ideas. If you see any fallacies please let me know! I'd appreciate any advice.
If the market is green tomorrow, maybe we will continue to see an up-trend? I believe we just started wave 3, so maybe we will hit that 160% soon?
Check out Cyclewave for better content. I'm learning and building off of his ideas. Thanks!


TG Therapeutics Inc (TGTX - NASDAQ) - Bulls in controlTG Therapeutics Inc (TGTX - NASDAQ) is in strong bullish cycle in 2 hr time frame. It is in 5th wave up, which is subdividing say extending just like 3rd wave. It is in 3rd subwave of 5th wave up. Stay bullish on three wave pull back until the 5th wave over. Below 19.49 the impulse cycle gets over.


TGTXEarly june is around the corner... $30 is coming soon..
I'm averaging 17.01 a share and own roughly 1700 shares.
Follow me on twitter @st0nkz


TGTX doughAnalysis done on 25/05/2020
Fundamental
→ 20 & 40 SMA sloping up
→ 20MA > 40MA
Awaiting buy trigger
→ CCI <-100
→ Low of daily bar touches 20MA or goes below 20MA
→ Close above 40MA
Pull trigger
→ Buy 1 bid above previous day high
→ Sell 5 bars later exclusive of initial bar
Stop Loss
→ 50% below price bought
