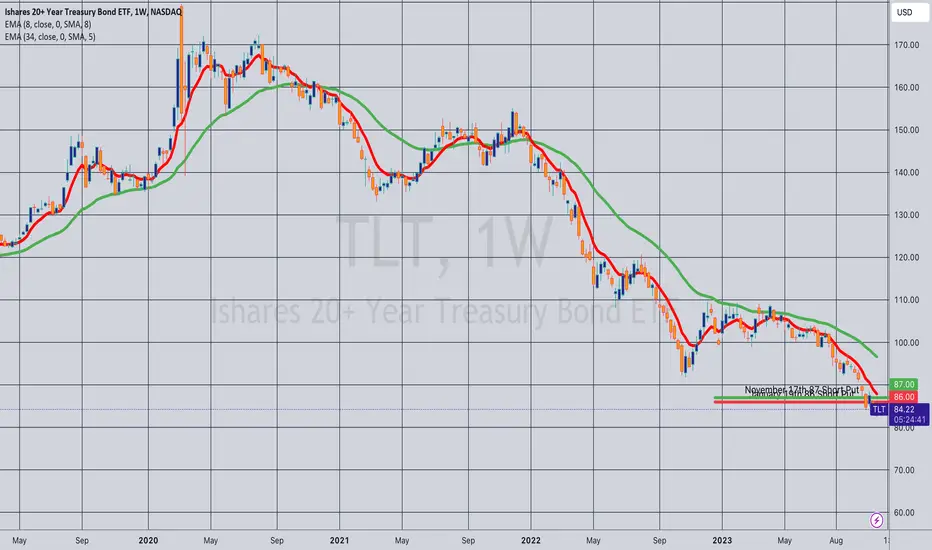
Rolling (IRA): TLT Nov 17th 87 to Jan 19th 86 Short Put... for a .65 credit.
Comments: Down a smidge and out. .76 collected originally. (See Post Below). With the .65 collected for the roll, 1.41 total.
TLT trade ideas
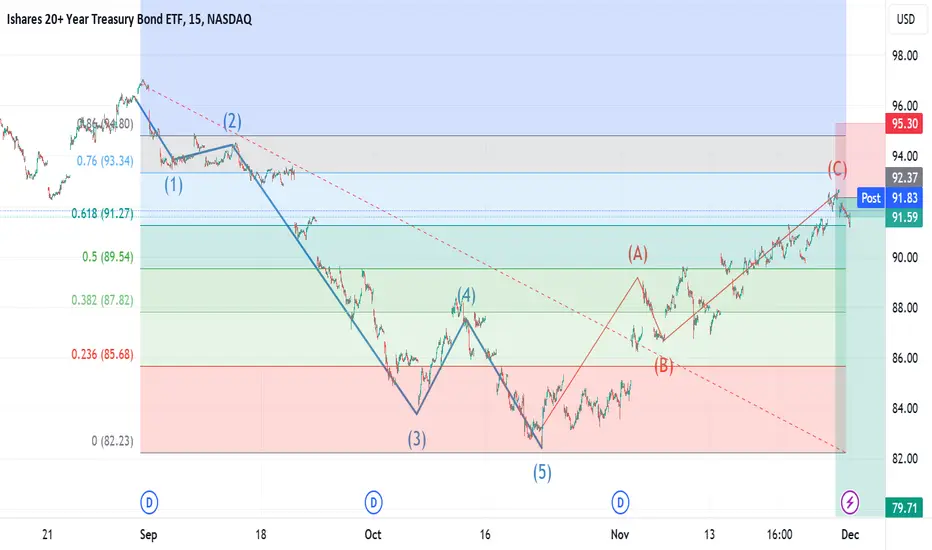
Possible End of Correction in TLT TLT has been in a rally of late. When I bought this at 84 I'd planned to hold longer.
However, this looks suspiciously like an Elliot correction.
Back to a bear bias on bonds.
Update to
Opening (IRA): TLT January 19th 81 Short Put... for a .85 credit.
Comments: Targeting the strike paying around 1% of the strike price in credit, looking to acquire shares should we get "down there."
I would've erected a rung in shorter duration, but didn't want to do that if I couldn't get in at a strike that was better than what I currently have on.

Opening (IRA): TLT December 15th 89 Short Put... for a 1.12 credit.
Comments: Squeezing in another rung in the December monthly at the 28 delta 89 strike ... .
Since I'm getting kind of a spaghetti works here, will primarily look to add in the 45 DTE weeklies and manage the rest of the pasta as duration in those positions shortens.

Opening (IRA): TLT Oct/Nov/Dec Short Put LadderComments: Targeting the 16 delta strike here in successive expiries to generate free cash flow and emulate dollar cost averaging into 20 year+ maturity paper.
October 20th 89: .77 credit.
November 17th 87: .76 credit.
December 15th 86: .84 credit.
Since these aren't paying buckets of cash on a per contract basis, I'll look to manage these on extrinsic approaching worthless either by closing them out in profit or rolling for credit and duration to reduce my cost basis further.

Big Bounce in TLT Possible HereThis has been in a crash of late and got a lot of attention for it but we're getting close to the levels where often even in a downtrend a big bounce is due.
With the caveat that this can rug if supports are broken, there's high RR long ops in this area.
Opening (IRA): TLT Nov/Dec 86/84 Short PutsComments: Targeting the 16 delta strikes in November and December to erect rungs at strikes better than what I currently have on to emulate dollar cost averaging into 20 year+ maturity paper.
November 17th 86: .83 credit
December 15th 84: .79 credit
Here, I'm fine with getting assigned and proceeding to sell short call against, but want to get in at the biggest discount the market will let me get away with because at some point, you know they're going to cut. Naturally, this may be months out in time ... .

TLTRetesting the support breakdown level as well as the weekly 20 ema & the 0.618 retracement from the recent decline. This chart looks similar to around this same time last year imo. Multi-week run up early Q4 back into the same levels mentioned previously. We'll see if we get the same result.

Treasury Bond ETF $TLT Trade IdeaNASDAQ:TLT is showing bullish momentum in its price action.
We see here that today, we closed above the previous high. The price seems to be entering the bullish gap area, and if it does continue the upward movement it could close the gap and reach $93 fairly quickly. $93 is also a resistance level, and we cloud also see a pullback in price around there.
if NASDAQ:TLT however breaks out above that $93 resistance, we could see it move up into the 2nd bullish gap above and to the diagonal resistance level at around $96-97. This resistance level has been tested numerous times as per the chart.
If the price is to continue moving up, it is important for the next daily candle to close in the green box area or above it.
Key moving averages are sloping up, but the bullish MA crossover structure is not complete yet.
Oscillators are also showing overbought so must be careful in the short term once and if we hit $93 in the short term.
Hope this was helpful to the readers.
Good luck with your trading!

TLT: Bearish Bat with Bearish DivergenceThere is a Bearish Bat with Bearish Divergence on the TLT, which could perhaps be signaling that the 20-year Bond Auction is going to demand higher yield than the current level.

Its still all bout bondsThis chart may help you a lot in understanding the bonds.
It seems to be pretty accurate ;)

Rolling (IRA): TLT Nov 17th 86 Short Put to Dec 15th 85... for a .32 credit.
Comments: Rolling down and out where it makes sense; out "as is" where it doesn't. Collected .83 originally (See Post Below). With the .32 here, 1.15 total.
I'm generally looking to try to avoid taking on shares above my current cost basis for the shares I've been assigned already and/or to take on shares at the best possible price that the market allows.

Opening (IRA): TLT February 16th 73 Short Put... for a .96 credit.
Comments: How ... low ... can you go? Targeting the 16 delta strike out in February at a strike better than what I currently have on in shorter duration expiries.

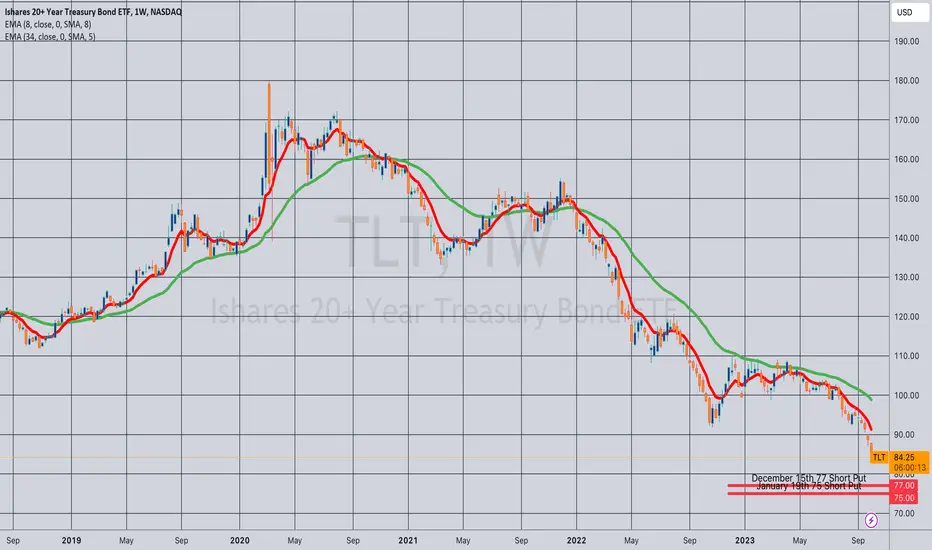
Opening (IRA): TLT Dec/Jan 77/75 Short PutsComments: Targeting the strikes paying around 1% of the strike price in credit at strikes better than what I currently have on. The basic bet here: that interest rates decline ... at some point.
(And, yes, it's been a somewhat painful trade so far ... ).
December 15th 77: .85 credit
January 19th 75: .84 credit
$TLT 20 Year Treasury Bond ETF The NASDAQ:TLT , or the 20 Year Treasury Bond ETF, appears to be undergoing a significant shift in its trend dynamics based on your description. Here's a breakdown of what you're observing:
1. **Bearish to Bullish Reversal**: This indicates that the ETF, which was previously in a downtrend (bearish phase), is showing signs of reversing to an uptrend (bullish phase). Such reversals are often identified through technical indicators like moving averages, momentum oscillators, or trendline breaks.
2. **Parallel Downtrend Break**: The breaking of a parallel downtrend suggests that the ETF has moved beyond a previously established downward channel. This is a technical pattern where the price moves within two parallel lines downwards. Breaking out of this channel can be a significant bullish signal, indicating that the selling pressure is easing and buyers are starting to take control.
3. **Bullish Consolidation**: After the initial reversal, it seems the ETF is now in a phase of bullish consolidation. This typically involves the price moving sideways or slightly pulling back, which allows the ETF to stabilize after the initial surge in buying activity. This phase often precedes further upward movement as it suggests that buyers are still interested at these higher price levels, and the selling pressure is not strong enough to push the price back down.
For a more detailed analysis, it would be beneficial to look at specific technical indicators such as Relative Strength Index (RSI), Moving Average Convergence Divergence (MACD), volume data, as well as key support and resistance levels. Additionally, fundamental factors impacting Treasury bonds, like interest rate changes, inflation expectations, and overall economic outlook, should also be considered to complement the technical analysis.
Remember, while technical analysis can provide valuable insights, it's always important to consider multiple factors and viewpoints when making investment decisions.

TLT ~ Have US Yields finally topped? (Weekly / Nov 2023)NASDAQ:TLT chart mapping/analysis.
Note: TradingView chart dividend adjusted.
Price action bouncing off Golden Pocket (66% Fib) support
Heavy trading volume = institutional activity (ie positioning?)
Rejection wicks on previous weekly candles = selling pressure still present (correlation with long-end yields holding strength)
Looking for re-test of lows + bounce to confirm double bottom support base established for bullish momentum.
Inverse play = price action engulfs previous candle, completes gap partial-fill + taps overhead resistance aka descending trend-line (light blue dotted).
Institutional short-squeezes could still be active - complimenting inverse play thesis.
Failure to break above/below either trend-lines = price action continues to contract until eventually ripping in volatile fashion in either direction.
Set alerts - monitor US yields - wait for trade to set up in your favour.

US10 years Bond Yield probably "peak". 10/Nov/23US Bonds probably the "Most Highly Bought Bonds" by any Countries's govermnt in the world (as safe haven). Time to buy US Bond ETF? E.g TLT, AGG, IEF etc?. What do you think saving money in US FIXED deposit bank aiming for 5% +/- gain ( while waiting for US dolar depreciate against most currencies pair) or buying US Bonds ( which is the inverse of US Bonds Yield ) or GOLD!? ( I Prefer Gold).

TLT: 20-YEAR AMERICAN TREASURY BONDS: SHARK detected. 20-YEAR AMERICAN TREASURY BONDS: SHARK detected.
We are in a potential turnaround zone.
The EMA.200 and EMA.50 are possible targets, as well as the red PRZ above.
To watch, as well as the ICHIMOKU / Bollinger / Fibonacci Levels

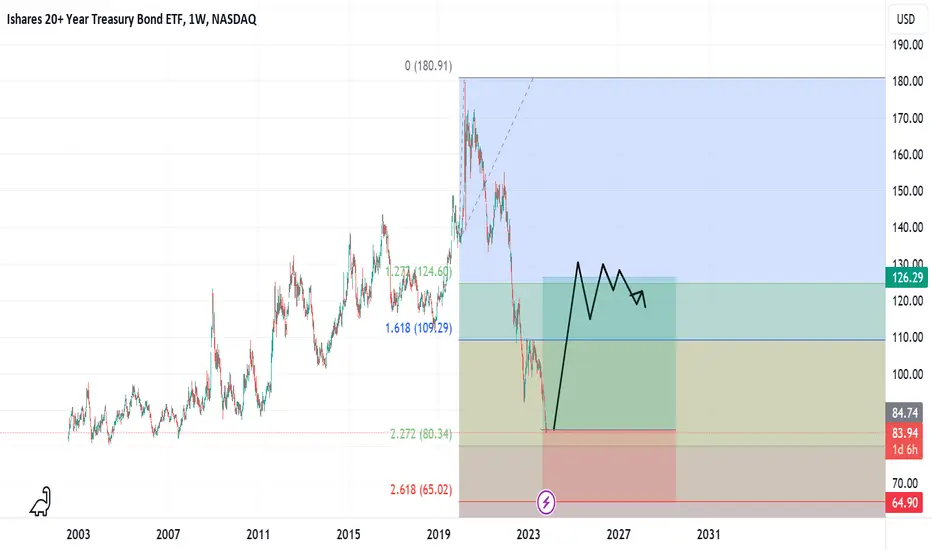
TLT lower for longer. LOW 81.32Middle of wave v of 3
Once wave 3 completes, we should see wave 4 an A-B-C movement toward 87-90 before we see a final 5 wave move down toward 81.
81.32 is the low from Jun 2002!
81.13 is the .18 fib retracement tool stretched between fib extension tool

TLT - Keylevels - WeeklyI am accumulating TLT, I have accumulated in the areas: 83,84,85,86,87 and I will continue to accumulate as long as the price remains below 92.
Over 92, I will stop accumulating.
Macro speaking, we have this falling wedge and once the interest rate cuts on the dollar will start, I expect TLT to react positively.
First of all, we need uS10years to start a correction.

Bonds: At 20 Year SupportTLT is back at levels that have held for 20 years.
Support is support, until broken.

Bonds are compelling as collateralEver since 2008, the world shifted more to the world of collateral and distrust, after the world of unsecured collapsed.
Treasuries are dollars are in the future. As long as uncertainty remains high (or increases) there will be a place for government loans. Treasuries yielding near 5% on most maturities is "good enough" when compared to the historical 7% ish from equities.
Technically speaking, treasuries may be forming a short term bottom.
Tactically speaking, the gap between treasuries and stocks is very wide.
Fundamentally speaking, there may not be enough reward to justify most large cap equities current yield when compared to the healthy yield in treasuries.
Risk speaking, the biggest risk in holding treasuries is the loss in opportunity and the risk of more dollar devaluation/consumer inflation loss of purchasing power.
In summary, Treasuries are worth a shot and they are likely de-risked at current levels.
I will be considering bullish option spreads.

