Biggest most amazing short squeeze TLTThe iShares 20+ Year Treasury Bond ETF seeks to track the investment results of an index composed of U.S. Treasury bonds with remaining maturities greater than twenty years.
TLT trade ideas

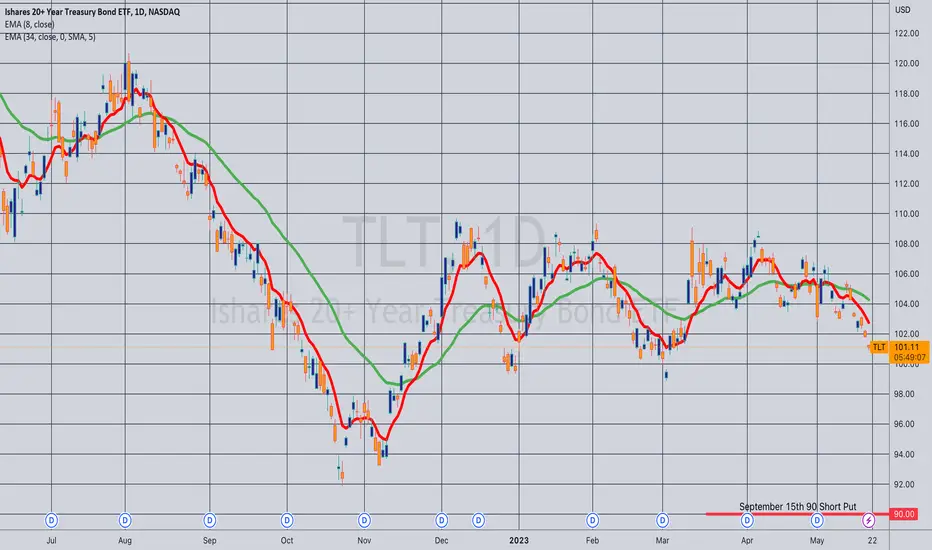
Opening (IRA): TLT September 15th 90 Short Put.... for a .73 credit.
Comments: The third rung of a TLT short put ladder. Will look to add at better strikes should we get additional weakness.
Bonds Bull Flag?You can ignore my arrow prediction but just for fun let's see how correlated it is.
But what we see here is that the NASDAQ:TLT broke below its triangle and now seems to be reversing after a cool CPI print. It seems to have make a bull flag and big consolidation range that I drew out in those purple lines.
Let's see if the bond market can continue with the bullish moves as it does make sense due to the way that the rate decisions have been priced in.
IMO one more hike then cuts next year and 2019 level rates by end of 2025.
NASDAQ:TLT can get to $115-$120 by May-July 2024
Exciting stuff let's see.

TLT major support 98 and whyThe chart posted is the last bullish possible wave structure . within the sideways movement since oct cycles We are setting up for a MAJOR PANIC INTO AUG 25th and a lower low in oct 10 week trade with this in mind

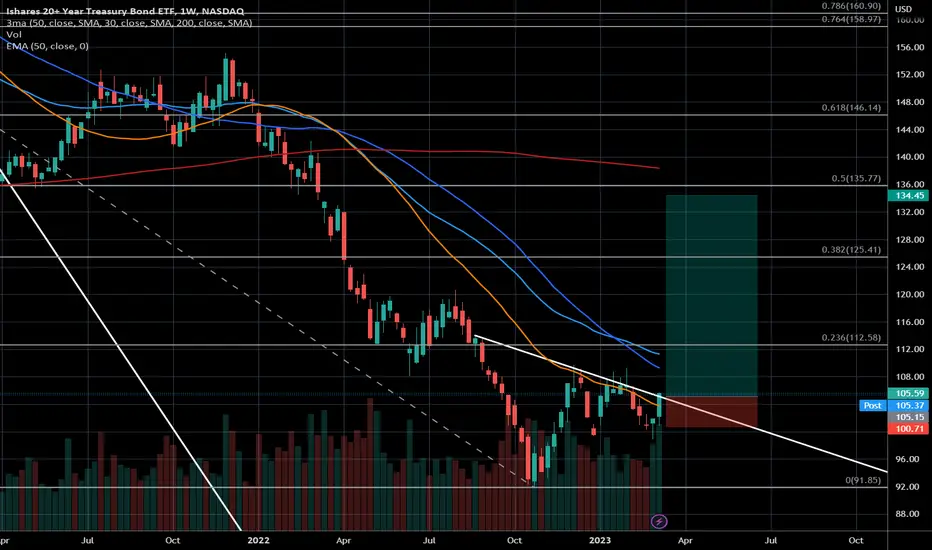
One of the most beautiful charts $TLT Wow what a beautiful chart. Almost done with a full market cycle. You may know this as a "dead cat bounce" or the "ANGER" part of the cycle... lol.... but we haven't even hit depression!? woooooo lol. What this indicates is that ole Jerome Powell boy isnt done raising rates..... and he is for sure going to keep them higher for longer... the next couple of years according to timing on this chart. "higher for longer"
Self explanatory chart.... just a thing of beauty

Opening (IRA): TLT August 18th 92 Short Put... for a .68 credit.
Comments: The second rung of a TLT short put ladder ... . Selling around the 16 delta strike here.

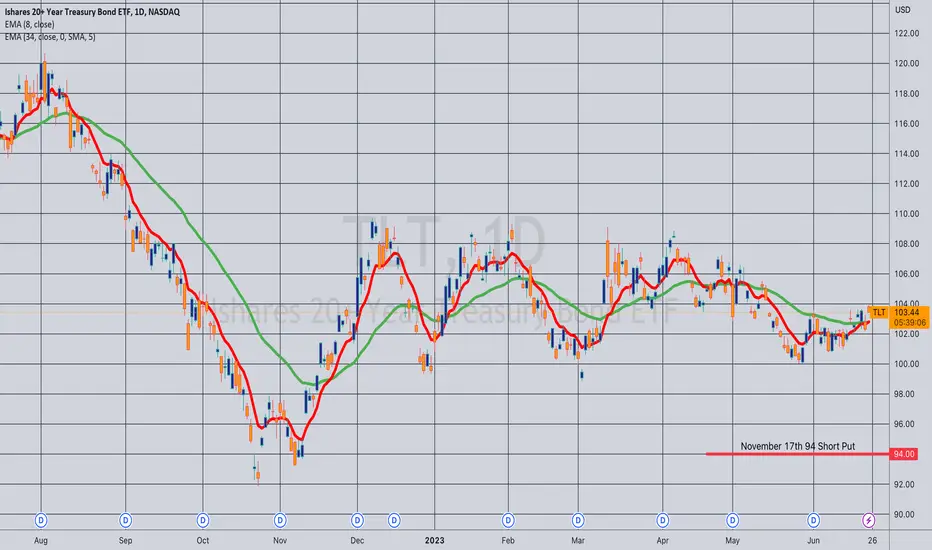
Opening (IRA): TLT November 17th 94 Short Put... for a .75 credit.
Comments: Continuing to build out rungs in 20-year plus maturity paper, targeting the 16 delta strike to emulate an equities/bond mix in my portfolio using short puts, particularly since TLT 30-day is actually greater than that in SPY (15.1% for the former; 13.0% for the latter).
As usual, I'm fine with taking assignment of shares at this level and then proceeding to "cover" (i.e., sell call against) if that happens.
Bong, Long BondI've got my eye on you Mr Bond. Zero slope MA nearly flat. Containment MA just turned 1, where I start getting interested. We will see if this week gives us action or maybe not til the Friday number. We will see.

Opening (IRA): TLT July 19th 94 Short Put... for .60 credit.
Comments: With 30-day IV higher than in SPY, selling some premium in 20-year maturity paper, targeting the 16 delta strike, with the plan being to build out a multi-rung ladder.

Treasuries on track for a crash in H2'23. 10Y above 10%.The triangle within wave 4 has ended. Either today, or on May 3rd. What will happen next has never happened before. The crash in Treasuries in extended wave 5 is scheduled for H2 - the time when 10Y will definitely hit above 10%, dragging the entire market as low as SPX 1000...1500.
The closest analogy to the coming crash is 1929. But remember - the crash of 1929 was just a correction within a 100-year long trend, which finally ended on Jan 4th this year.
The coming crash will be one fractal level higher: it will be part of the correction to the entire 100-year long bull market in the US.

Opening (IRA): TLT July 21st 92 Short Put... for a .63 credit.
Comments: With 20 year+ maturity paper 30-day IV greater than that of SPY, adding a smidge to my position here at better strikes (but still around 16 delta) than what I currently have on.
As with my broad market positions in IWM, QQQ, and SPY, looking to emulate dollar cost averaging into long-dated treasuries here without actually hanging out in stock.

TLT moving averagesThis chart of TLT the long term US treasury bond ETF uses moving averages to attempt to see potential support and resistance. This uses 10 month, 200 day, 100 day and 20 day. My interpretation of this chart is bearish and potentially a good place to short it.

Update On Interest RatesRate Update!
The United States, being the world's largest economy, often sets the tone for global interest rate trends. The Federal Reserve, the country's central bank, has been carefully monitoring economic indicators and inflationary pressures. Recent data have shown signs of rising inflation, prompting the Fed to adopt a more hawkish stance. While no immediate rate hikes have been implemented, market participants anticipate that the Fed may increase rates in the near future to curb inflation and maintain price stability.

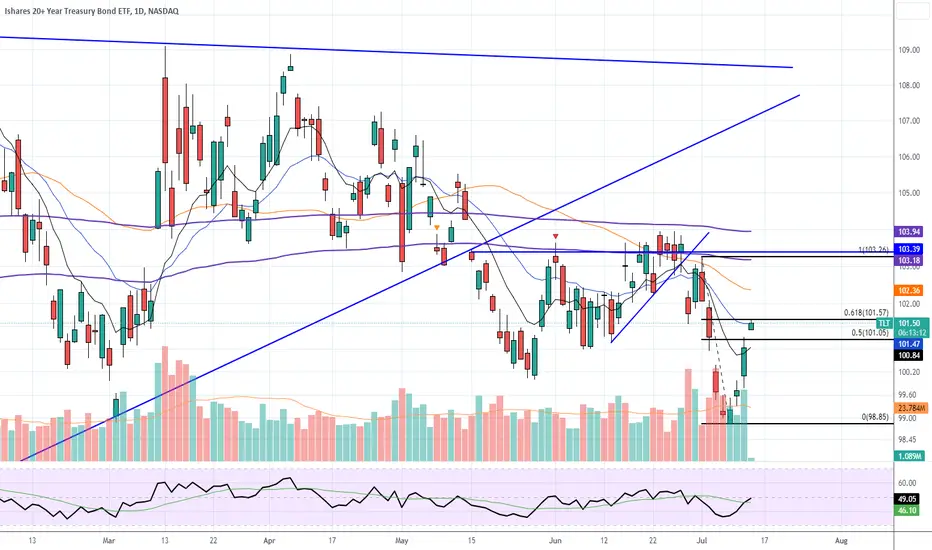
TLTAfter breaking down out of the triangle, price is now retracing to the 0.618 of the recent down move as well as AVWAP from the 52 week low. I like puts at this price.

TLT: UNDERVALUED, OVERVALUED OR JUST OVER? (INVERTED CHART)While doing some research for this chart I noticed this article titled: Noteworthy ETF Inflows: TLT.
Being that the charts generally tell you what is going on before the news does, this made a lot of sense
and what I would be expecting to see, given the broader economic conditions of the Earth realm.
Looking at an inverted chart illustrates quite clearly, what kind of price action we can, most likely,
anticipate from the TLT ETF. I have much more to add to this chart but my time has run out this
morning. So look for updates moving forward.

Da bondsThis is the NASDAQ:TLT I'm long the AMEX:TMF and going to be long the AMEX:ZROZ as well with this good debt ceiling news.
On the chart I'm seeing a bottoming candle in a demand zone on the weekly chart.
I'm also seeing high volume maintaining.
Furthermore, those moving averages are close together, so I think the extraordinary signal will be NASDAQ:TLT above $110 and those moving averages crossing.
I could hold this trade for years and not care while collecting dividends.
Another thing, in 2011 we got a deal and the day of the vote everything freaked out then our debt got downgraded and bonds rocketed.
This is a great RR imo.

BITO, FXE, GLD, TLTThe markets BITO, FXE, GLD, TLT are all under extreme downleg compressions. A resolution or resolution failure could cause an extreme reaction in any or all of these markets. If there is a marked retracement in any of these markets an out of the money call position could offer an exceptional opportunity even if only one of these markets complies, IMHO.

TLT Bottoming? TLT may be forming a basing pattern here after breaking down from the triangle pattern. Could be a good time to scale in here.

#TLT H4 Range Trading OpportunityIn this update we review the recent price action in TLT and identify the next high probability trading opportunity and price objectives to target

$TLT longSee chart image. I wish this breakout was a bit higher but according to my rules we have no a breakout. So let's see how this setup unfolds. According to fundamentals I see the prices for this kind of instruments rather rising.
Good trades!
TLT / TBT Ratio - a bonds long and short oscillatorOn the daily chart- I have plotted the TLT (Long Bond Leveraged) ETF vs the TBT (Short
Inverse) as a ratio. The ratio is running on a cycle between high and low. On the chart for
reference is a Hull Moving Average of 20 days. A more frequency cyling could be achieved
with a paid Tradingview subscription and a charting time frame of 2 or 4 hours.
For the trading idea, when the hull moving average is upgoing and the price is above it, the TLT
can be bought while when the moving average of the ratio is decreasing and price is under it,
the TBT can be bought. At a high pivot point, all TLT is liquidated and a TBT trade is taken .
For a low pivot point, TBT positions are closed and TLT long trades are taken. The best trades
are at the pivot points and when a doulble top or bottom are put onto the chart.

