$29.99 by Aug-Sept 2023? Impossible.Treasuries are falling and nobody seems to care. The comparison to the Titanic is very valid. That scene from the movie, when the ship has already hit an iceberg, the engines brought to a halt, but the rich kids just keep playing with chunks of ice on the upper deck. Close-up on a bar table.. and a glass of whisky slides off, falls on the deck and breaks into smithereens. End of part One.
I will tell you what's going to happen next. First, we will see TLT at 88-92. This will mark the end of wave 1 of the sell-of in green wave 5. Once the correction is over, the sell-off will continue, and when we break below 88, it's all gone: we will almost immediately see 40..45. This will mark the end of wave 3 of green wave 5. The downtrend will continue after a brief correction in wave 5 of 5. I will dare make a prediction that TLT will reach below 30 at the tip of wave 5 of 5.
$29.99 anyone?
By the time TLT reaches 29.99:
- SPX will be at 1500,
- EURUSD will be at 0.75
- USDJPY will be at ~100
- EURJPY will break below 88
- 10Y will to my great delight break above 10%.
Oh, and Ukraine will start peace talks with Russia on Russia's terms..
TLT trade ideas


The Titanic of Treasuries has just hit an icebergThe triangle is now 100% completed, and wave 5 is imminent. And nobody seems to care. As it should be.

TLT - Intermediate BUY Set-UpHere is my road map for TLT... T-Bonds
This will have significant ramifications across many correlated markets. Think ES, DXY, Gold etc...
I believe we close to embarking on a C wave move up to the opposing upper channel line. This could take on a variety of shapes/slopes. Time will tell.
The bigger move ahead is down... although the move ahead will be worth participating in.
See my published ideas linked below covering TBonds yields and ES/SPX pathways related to this supposition.
Weekly view of TLT here:

TLT - All debts, public and privateTo even imagine the US defaulting on any of its debt is just unthinkable. But here are my pivot points for it coming true or fearing that it might come true and the relief when the recurring debt default silliness is behind us once again. The move in either direction might be rather significant and I would be happy to be on board for either direction.
TLTBearish below $103. Bullish above $110. Consensus seems to be that the Fed is done raising rates. What if they aren't?

Hard to see this break downThis looks like it could break below trend, which could be because of the strong jobs market… but rates have nowhere to go but down. I will be buying 3 month calls on TLT Monday morning.

Wave 4 continues to evolveThe triangle continues to evolve, and is not finished yet. Ideally I would like to see one last upswing to 108...109, and then the triangular wave 4 will be completed.
The completion of wave 4 is what separates the calm from the true storm. The crash of Treasuries in wave 5 will produce a worldwide market crash not even comparable to those of 1929, 1987, 2000, or 2008.

Latest Rate Trend
The current probability of interest rates, as depicted in the chart, indicates an improvement rather than a decline, with the expectation of this trend emerging shortly. Presently, I am opting to float rather than lock rates, at least until next week. The Federal Reserve's modest increase of 25 basis points suggests a potential deceleration or cessation of rate hikes. The imminent failure of PacWest Bank highlights the impact of the Fed rate hikes on the economy, necessitating a pivot or reversal to prevent widespread failures.

TLT TimeLong term bond trade. Might be early to the ride here and I'm going to be a little more loose with the stop on this one.

TLT - a long slide and now ???Are we done? Lower long rates with a recession? Or a collapse with default fears or other economic reasoning? I have my MA levels and will wait and watch.
Wave 4 still has the powerThe trend still remains possessed by the triangle in wave 4. FOMC meeting is tomorrow, and waves E of major trends often end on the news.
The news never define the market. Traders wait for the news not to trade the actual statistics or decision, but to see what the others will be doing in response to the news. A few seconds or minutes after the news hit the wire the entire process of "trading the news" gets reduced to simply looking at the charts and trading the structures that have been there since long.
This week the TLT chart should produce a spike towards 108..110, potentially even making a shallow new high, and then the structure will be completed, the triangular wave 4 will end, and wave 5 will begin.
Wave 5 of the sell-off in Treasuries is inevitable, it will bring 10Y to 10%, cause a crash of the Euro to 0.75, and will force SPX to land at 1500. In the next 2-3 months we are going to see an event that never happened in the history of the markets.

Wave 4 is very likely completedThe triangle in wave 4 looks very much completed. It is very likely that wave 5 has already begun, and the final countdown to the crash has started too.
The clock is ticking. By August 23rd (very likely even earlier) the crash will not only begin, but it will already be wrapping up.
SPX will be at 1500 or lower, while 10Y yield will reach 10%.

Long bond TLT looking more and more constructive in this rangeThe TLT has been mostly chopping sideways for the last 4 months, and while it is still directionless, it has been able to stay above it's cycle lows and not roll over to retest them.
This consolidation is looking more and more healthy and if we can finally get some closes above 109, this could finally initiate a second leg higher to those Q2 2022 levels. Started a position here and would add on strength on continuation.

Treasuries update. Wave 4 still in progress.The complete structure of wave 4 will neatly resemble a classic triangle, only wave E will break to new highs.
This is the last attempt of the market to buy the dip in Treasuries. (Also the last attempt of EURJPY to reach a new high - should stop around 157 next week).
After that wave 5 of the downtrend in Treasuries will commence, targeting the peak of the crash in H2'23.

Wave 4 in TLT is almost overI still cannot confirm that the triangle in wave 4 has ended. Triangles take time to develop, but once they are over, wave 5 almost always takes less than 0.618 of the duration of wave 4 to compete.
If W4 ended today, then the crash in Treasuries should end before 23 Aug 2023: by that time we will see 10Y at 10%.

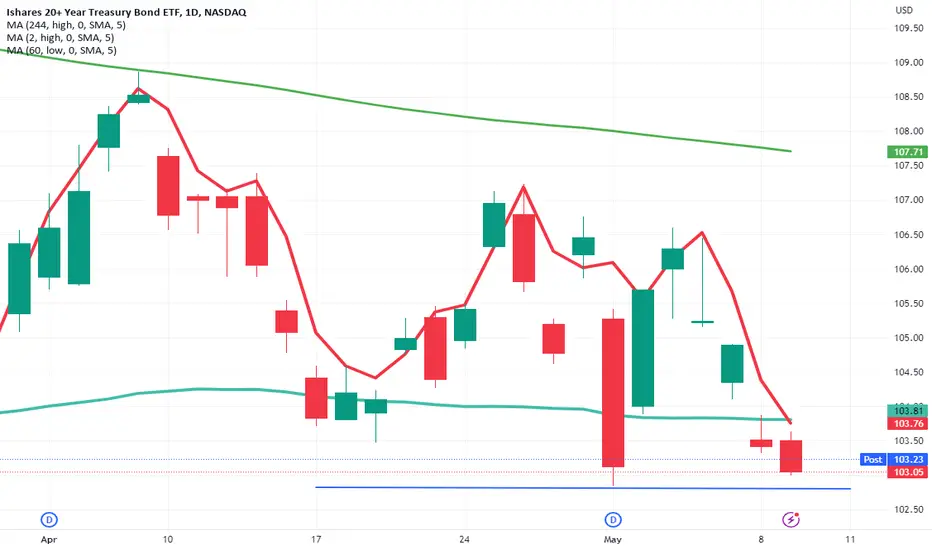
TLT - Dominant is short side, but upside reversal nearbyAbove 105.5 would represent upside reversal. I will watch for it and trade to the long side if it pops.
TLT broke the containment MA but the next is the cycle pivotThe 13 day MA of lows in TLT is a great example of a potential cycle pivot. This is the current zero slope MA. After TLT broke the containment MA, this is now a critical MA to watch for possible next move.
Are Rising Rates in Store? 🏠📈🔥Trending Mortgage Interest Rates Video🔥: Expert Analysis by Las Vegas Mortgage Broker Andrew Leavitt - Are Rising Rates in Store? 🏠📈
Stay ahead in the game with Andrew Leavitt, a leading Las Vegas Mortgage Broker, as he provides expert trend analysis on mortgage interest rates! Unveil the market's direction: rising interest rates or something else? Don't miss it! 🚀
If you're a Las Vegas homeowner or aspiring homebuyer, this in-depth analysis of mortgage interest rates is essential for your financial planning! 🎯
🌟 Key Phrases: Las Vegas Mortgage Broker, Mortgage Interest Rates, Rising Interest Rates, Rising Rates, VA Loan Las Vegas, FHA Loan Las Vegas 🌟
Discover the factors impacting mortgage interest rates in this comprehensive video. Whether you're considering a VA Loan Las Vegas or an FHA Loan Las Vegas, understanding these trends is crucial for making informed decisions. 💸
Join Andrew Leavitt, our Capital Markets Head, as he examines mortgage interest rate trends and anticipates their future direction. Will the market face rising interest rates or witness a new trend? 🤔
Andrew Leavitt, a renowned Las Vegas Mortgage Broker and Secondary Markets specialist, holds the position of Vice President of Secondary and Systems at Pinnacle Lending Group. With extensive industry experience, he's the go-to expert for navigating the complexities of mortgage interest rates and making sound financial choices. 💼
Don't miss this vital information! Watch the video now and stay ahead of the curve with expert guidance on mortgage interest rates! 🔔
🔑 SEO Phrases: Las Vegas Mortgage Broker, Mortgage Interest Rates, Rising Interest Rates, Rising Rates, VA Loan Las Vegas, FHA Loan Las Vegas, Andrew Levitt, Pinnacle Lending Group, Secondary Markets 🔑

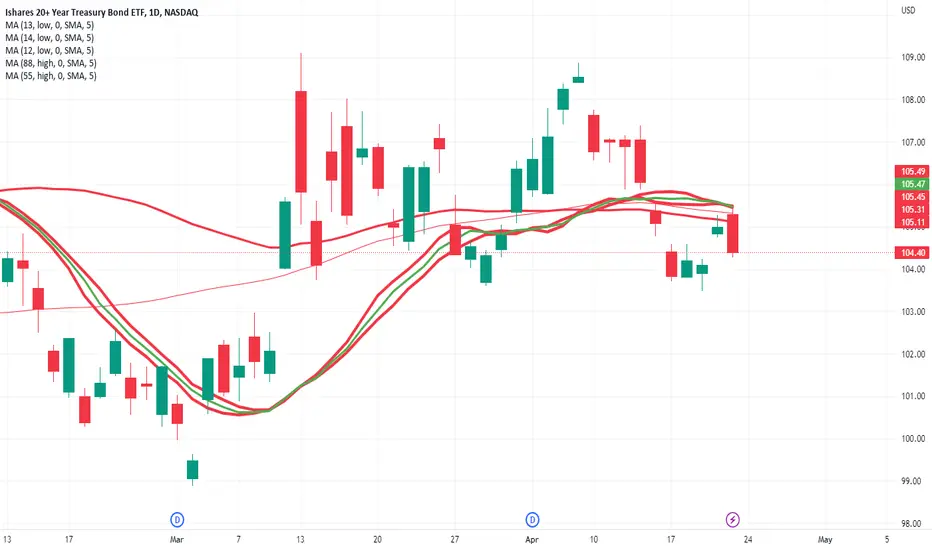
TLT - is this the low?4 days under the 4 day MA of medians. This to me is a very compelling level for a long and or when/if TLT breaks up through it.

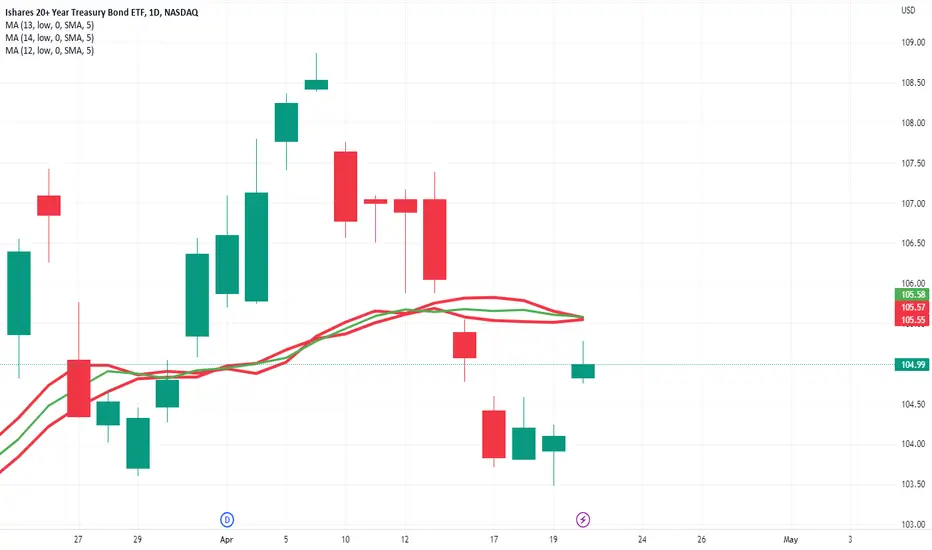
TLT oversold presents an opportunity7 days below the 4 day MA of highs. 3 days below the 3 day MA of medians. I'd be long on a higher high.

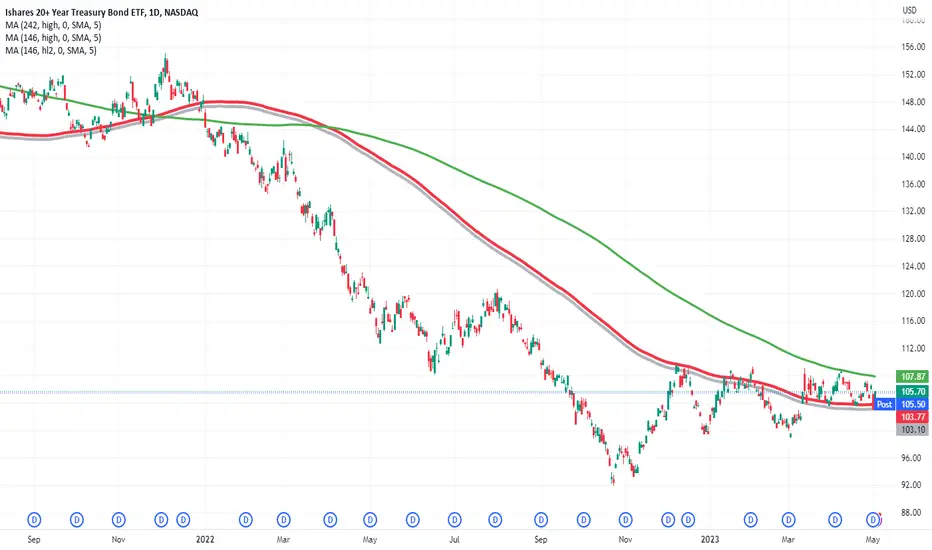
TLT back to 100Hard rejection from 109 last week and weekly 50sma.
Entry - below Daily 50sma at 104.50 (Purple line)
Stop loss - 200sma or 106

