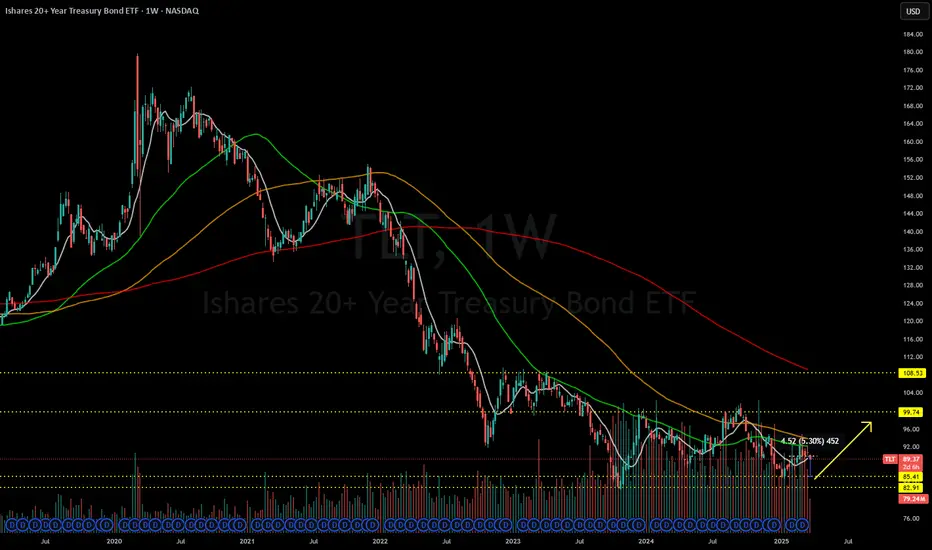
TLT poised for bull flag breakout this weekIncreased volatility from tariff news will likely send us out of this channel if TLT shows even slightly bullish price action.
TLT trade ideas

TLT 103American 20+ bonds continue to hold a significant weight in my portfolio, and most importantly, the factors supporting their growth are increasing day by day.
Inflation in the U.S. will decline not due to monetary policy but because of economic stagnation and potential risks. Tariffs will raise goods prices, but at the same time, they will negatively impact consumer sentiment.
TLT is heading toward 103, which aligns with my technical outlook.

TLT longer term high...I do dowsing and checked on TLT today. My work is suggesting this is a longer term high and that TLT will move down to around $85.
I'm not the best at getting time frames for things to occur, but I ask anyway. At a minimum dates more often than not signal some kind of reversal - though it may only be short term. Anyway, I get $85 in about 21 days, or 3/19. I like TLT options. They're cheap and if TLT can keep from any close higher than these highs, I think good odds for down.

Long TLT/Short Bitcoin.Good morning everyone here’s an idea that I see playing out; someone or some entity found arbitrage by shorting the long end of the curve (TLT) and going long bitcoin. We could see the bonds rally and bitcoin sell off. Cheers,

TLT Wyckoff accumulationTLT appears to be in an accumulation pattern. Bond Yields look distributive, so that correlates.

TLT hitting bottomTLT near the bottom.
Rates go down, bond face value go up.
Long-term bonds rates need to come down otherwise US government interest payments will take up a high parentage of their budget.
Gold vs. U.S. Government BondsIs gold safer than government bonds? The data suggests so.
Since March 2020, long-term U.S. government bonds with maturities over 20 years have fallen close to 50% in value. Gold is up almost 100% over the same period.
Do you think these trends will continue? I certainly do.

Are bonds (TLT) about to fall?I've been thinking for the past few months that TLT would rally up to the 100 area. However, that move hasn't materialized and now I think there's a chance of yields rising and bonds falling. Over the past few weeks the chart has morphed more bearish.
It looks like something should set off the bond market this week and cause a lot of volatility in bonds.
I think there's potentially a chance we see the lower supports get hit before we see a relief rally.
Let's see how it plays out.

$TLT - expecting to break above 200DMA on next attemptAs expected, NASDAQ:TLT met with strong resistance and has backfilled the gap. It is most likely to break through the 200-day moving average (200DMA) resistance on the next attempt. Many hedge funds are shorting long-term bonds, which could create a short squeeze scenario.

TLT Flight to Safety Inverse Cup and Handle and a breakout.
Not financial, but this looks possible.
What does it say for the rest of the market?
Be cafeful out there...

TLT Short-Term Short SetupOverview:
TLT has likely completed Wave (3) in its Elliott Wave structure and is now entering a corrective Wave (4). The RSI is in overbought territory, suggesting a short-term pullback. Additionally, there are unfilled gaps near $85, which could act as downside targets in the upcoming corrective phase.
Technical Signals:
Elliott Wave Count: Wave (3) appears completed, setting up for a corrective (4) move.
RSI Overbought: The RSI is signaling a possible reversal.
Gap Fill Target: Unfilled gaps exist near $85, aligning with key Fibonacci retracement levels.
Resistance Zone: Price is approaching resistance between $95 - $96, making it a crucial level for rejection.
Support Levels: First support at $90.33 (Fib 0.382), followed by $87.21, and a final gap-fill zone near $85.
Wave (4) Correction:
A retracement toward the $90-$87 range is expected before the uptrend resumes.
This would shake out weak longs while setting up for Wave (5).
A Fib 0.382 retracement (around $90.50) could be a key level for Wave (4) to complete.
Wave (5) Potential Move:
If Wave (4) finds support, TLT could enter Wave (5) to new highs, potentially targeting $98 - $100+ before forming a larger top.
However, if the corrective structure extends beyond $85, it may indicate that a deeper ABC correction is in play.

TLT: Potential Reversal After Completing ABC Correction [LONG]NASDAQ:TLT
Observation:
The iShares 20+ Year Treasury Bond ETF (TLT) appears to have completed its C-wave of an ABC Elliott Wave correction. Prices have shown signs of consolidation around the critical support zone at $87.50, suggesting the possibility of a double-bottom formation.
Support Zone: TLT is consolidating near the $87.50 level, which has historically acted as strong support.
Elliott Wave Structure: The recent price action indicates the completion of a corrective ABC structure, with the C-wave potentially marking the final low.
Bullish Outlook: If the support holds, the ETF is likely to resume upward momentum, targeting the $94.00 level as the next key resistance.
Double-Bottom Potential: Retesting the support zone could further validate a double-bottom reversal pattern.
Risk Management:
Set stops below $85.14 to minimize downside risk.
Monitor overall market sentiment and bond yield movements, which can heavily influence TLT's price action.
Disclaimer:
This analysis is for informational and educational purposes only and should not be considered as financial advice. Trading and investing involve significant risks, and you should consult with a qualified financial advisor or conduct your own research before making any investment decisions. The author is not responsible for any financial losses or decisions made based on this analysis. Always trade responsibly and within your own risk tolerance.

TLT: Strong Buy in My Radar List - Feb. 26Technical Analysis (TA) & Price Action
TLT (iShares 20+ Year Treasury Bond ETF) has been steadily climbing, breaking through key resistance levels and forming an ascending trendline on the 1-hour chart. The price action suggests continued bullish momentum with a breakout above $91 and potential for further upside.
Key observations:
* Trend Structure: TLT is in a clear uptrend, forming higher highs and higher lows.
* Support & Resistance:
* Major Resistance: $92.50 (PUT resistance) and $93.50 (2nd PUT Wall)
* Key Support: $91 (current breakout level), followed by $90
* Stronger Support Zones: $88 - $87.79
* MACD Indicator: Showing bullish momentum, with signals aligning for continuation.
* Stoch RSI: Slightly overbought but still has room for further upside before a pullback.
Options Flow & GEX Analysis
The GEX (Gamma Exposure) indicator highlights a strong call concentration at $91, indicating a potential gamma squeeze if price holds above this level.
* IVR (Implied Volatility Rank): 39.6, with IVx avg at 15.9%, signaling moderate volatility.
* Call Side Bias: 17.9% of options flow, supporting a bullish breakout scenario.
* Key GEX Levels:
* CALL Wall Resistance: $92 → Breaking this level could push toward $93.50.
* PUT Support Zone: $88 - $87 → A breakdown could trigger downward momentum.
Trade Plan & Suggestions
📌 Bullish Trade Setup (Preferred Play)
* Entry: Above $91 with confirmation (sustained hold above resistance).
* Target 1: $92.50
* Target 2: $93.50 (2nd PUT Wall)
* Stop-loss: Below $90
📌 Bearish Alternative (Hedge Play)
* Entry: Below $90 with volume breakdown.
* Target: $88 → $87
* Stop-loss: Above $91
Final Thoughts
TLT is in a strong bullish structure and could see further upside if it holds above $91. Options data suggests a gamma squeeze toward $92-$93.50, but failure to sustain $90 could bring a retracement. Keep an eye on volume confirmation before taking positions.
📢 Risk Management: Adjust position sizes and stop-loss levels according to your risk tolerance.
🔹 Disclaimer: This analysis is for educational purposes only and does not constitute financial advice. Always conduct your own research and manage risk accordingly before trading.

TLT: Flight to safety breakoutTLT is breaking out. It's not signaling that interest rates are falling - we know we are gonna get interest rates high for a longer period now. This time, its hinting that investors are risk off.
We are also seeing some red flags in the market. Financials, and communications sector seem to be topping. Breakout trades are failing. I say a pullback in the market is coming really, really soon.
Bet on TLT.


$TLT - Well we are waitingNASDAQ:TLT saw yet another rejection, but this time it recovered quickly. I expect it to break out soon. 🙏
TLT is slapped around by the Fed, inflation, employment data, Trump’s tariffs, and Doge's push to cut government waste and potential handout of $5000 dividend for all.
Bond traders will eventually give up trying to figure this out.
One thing is clear: The Treasury Secretary and President Trump have stated that they are focused on lowering long-term bond yields. It is in the best interest of the country to lower long-term bond yields to reduce the government’s interest payments.

TLT: Buy ideaA high probability of an upward trend on TLT in the event of a strong break of the resistance line as well as the vwap.

Dip Buying Opportunity In TreasuriesHot CPI providing a good dip in Treasuries which could recover quickly like a similar dip in late May 2024. We are in a buy support zone given the last year or so of trading range.

Invest in TLT for Stability Amid Market Volatility
- Key Insights: TLT has shown resilience by maintaining its position above the
50-day moving average, highlighting its appeal as a safe-haven asset amid
stock market volatility. The ongoing demand suggests that investors are
looking for protective measures against macroeconomic challenges. A
supportive environment could see TLT potentially rallying higher, making it
an attractive opportunity for those seeking stability in uncertain times.
- Price Targets: Next week targets are as follows: T1 is set at 91.50, T2 at
94.00. For stop levels, S1 is at 87.00 and S2 at 85.50. This framework
offers a clear strategy for both entry and risk management, reflecting
current technical support and resistance dynamics.
- Recent Performance: TLT has experienced mixed performance amid fluctuating
bond market conditions. While the broader market has seen sell-offs, TLT's
ability to hold above important technical levels reflects its appeal to
risk-averse investors. The overall sentiment indicates that many are
favoring bonds over equities as they navigate uncertain economic conditions.
- Expert Analysis: Experts point to TLT's attraction as a hedge against equity
market instability. The prevailing risk-off sentiment has boosted demand for
long-duration bonds, with analysts suggesting that buying pressure may
propel prices higher if macroeconomic fears persist. This reflects a
fundamental shift in investor behavior, emphasizing the need for security
amid existing volatility.
- News Impact: There haven't been significant news events directly tied to TLT
recently, but the prevailing environment of stock market turbulence has
prompted many to flock to bonds as a safer investment alternative. The
ongoing dialogue around Federal Reserve monetary policy and its impact on
yields is also influencing market dynamics, shaping a complex narrative that
underscores the significance of TLT in the current financial landscape.

Market Update - 2/9/2025Caught the EP nicely on NASDAQ:AFRM , and the breakout on NASDAQ:MGNI , but other than that we're still in a bad environment, the distribution days and declining breadth are not good signs. Will remain cautious.

$TLT yieaahhhliking NASDAQ:TLT here.
This is a monthly chart fyi
1. Forming nice head and shoulders knees and toes
2. RSI and price divergence since 2023
3. just bounce of a strong line of support last 2 months
My gut says if we break the resistance at current price, we can go quickly to $94.
Medium term, $120 will act as a magnet with the lack of volume between current price and that area.
Long term aiming for the green dotted line for the middle of the channel, but hey I ain't got no patience.
Playing for the $94 and then hopefully $120 comes fast.
This asset tends to do good when there is market turmoil, at least it has done it in 08, and covid. Just putting this out there while wearing my tin foil hat of cheap aluminum.
yieaahhh

Update: TLT March 21st 95 Covered CallsA "refresh" of a fairly long-running cash flow setup, with the cash flow emanating from (a) short call premium and (b) dividends.
As of the 12/18/24 dividend, my break even is at 85.81 (including dividends). (See Post Below).
One of my New Year's resolutions is to be a little more patient and roll out the short call on approaching worthless, targeting the short call strike paying around 1% of the strike price in credit, but my mouse hand occasionally seems to have a mind of its own ... .

TLT entry point at 89, take profit at 110, good luck guys!As we predicted in previous analyses, Trump's populism knows no bounds, which is why over the next four years we will continue to witness numerous statements, threats, promises, and their softening when it comes to implementation.
This was Trump 1.0, and this is what Trump 2.0 will be like over the next four years. He is afraid of a stock market crash, he fears the numbers, he fears inflation, and he fears high interest rates.
A new attractive entry point for TLT could be 89. And over the next 1-2 years, expect it to reach 110+.
10y market promises ~3.5% yield.
