is sp500 topping out soon?this chart is TLT/JNK and TLT and SPY overlayed.
Blue=sp500
orange=TLT
candle= TLT/JNK
TLT trade ideas

TLT BOTTOM NEW BULL PHASE 147 NEXTWe have ended the drop in TLT today we will now see a run first to 147 area Then I will post as to what the next move could be . But for now long TLT

TLT - 20Yr Bond ETFThe Monthly Chart continues to expand in Range.
This is interesting as the Range Broadens the implications
are quite Dire longer term.
TLT was sold heavily prior to the ROC SPike in TNX.
ZN was sold on Volume as well, an Instrument we have repeatedly
discussed for its weakening structure.
__________________________________________________________
Attempting to apply "Convention and Rationale" to an aging Trend
is generally, an Idea whose validity should begin to come into question.
FASB 56 alone is enough to bring the operations within the Shadows of
the Bond Market under duress over time.
It is clear the BIS is backstopping this operation - at what cost, we can
only surmise.
___________________________________________________________
The Real Issue moving forward for the Bond Complex is one of simplicity.
Rates will, in the Short Ter react to Policy and the perceived threat of
Inflation.
Shadow Operations will require time to unfold, but we believe this process
has begun, it will not be brought into he light of Day any time soon, but will
eventually, appear in the form of unexplained loss of confidence around the
Globe.
This will, of course, be devastating to the US Dollar. rendering it a 50 Level
once 82 and then 77 are broken.
_____________________________________________________________
The competition between China and the United States is well underway
and is accelerating on many fronts.
With the US Losing its advantages due to its inability to produce Value
across former dominant Sectors of Global Trade - a 22nd Century pivot to
Asia will continue to gain in both scope and scale, as well as velocity.
Financial Isolationism within the approaching rebalancing of Global
financial Arrangements will render the US to a weighted SDR status
with less than favorable terms and conditions.
This will have a devastating effect on the US Bond Market.
The curve will be converted to a Perpetual Duration with Principals
retired. A balance sheet liability which cannot be reduced without
far greater and far more insidious distortions.
It can never be eliminated.
Never, it is not mathematically possible. Therefore it will be erased to
bring balance. Think of it as the FDIC/SPIC coming to save $250K of your
$20 Million.
You lose, they win.
They default in an extraordinary manner and provide token assurance
that... one day... they swear to make you whole.
It will never happen.
___________________________________________________________
This is axiomatic, pure, and simple.
Regardless of the Gyrations... The Future is not "Uncertain" with respect
to Bonds and how they will be all but eliminated.


It's been rough, guys...Yep, everyone's bleeding to the teeth... More leveraged folks had to make decision on their margin calls... It hasn't been pretty...
But as a friend told me recently,
"All markets are red
Just a matter of when and which
stocks/coins rebound first
Same cycle
Same game"
^Disclaimer: Above is not a Haiku poem (but yes i formatted it as such)
So back to basics:
What are we seeing here:
- 10-year Treasury is popping
- 20-year Treasury lost steam
- Dow Jones broke out & lost steam (R @ 36526 to 36626 --- rejected 369ish - let's say 37000 for now)
- VIX looks like it's getting for some real action in about 2 to 8 weeks
It's rated as Neutral because who the #### knows (or we can say ONLY THE LORD KNOWS). Fasten your seat belts. Turbulence (or opportunity) ahead.
Rooting (reluctantly) for:
- Genomics sector
- $SHIB Shiba Inu coin
- $CAKE Pancake Swap coin
- $BNGO Bionano Genomics
- $SOFI SoFi
- $VLD Velo3D
and last but not least
- $JEWEL DeFi Kingdoms --- really interesting
Let me know what you guys think for the upcoming 2022. Cheers & wishing peace and prosperity to everyone!! (And ofc I can't do that but only the LORD can).
Cheers,
Noob Investor

TLT - LONGAs we know, news media and their narratives are far behind. In fact, inflation began back in late 2020 and continued all throughout 2021. Now it has peaked, as commodities and the CRB are signaling lower highs into mania. There is a nice pattern forming on the daily here, so watch the lower time frame for a reversal and flag. Can also buy Gold and Real Estate EX ITB or the like, and probably be comfortable on the short side of most commodities.

TLT Looks the most likely scenario to me
Inflation hedges are not doing well
Something has to give
GRI 2022
Trade at your own risk

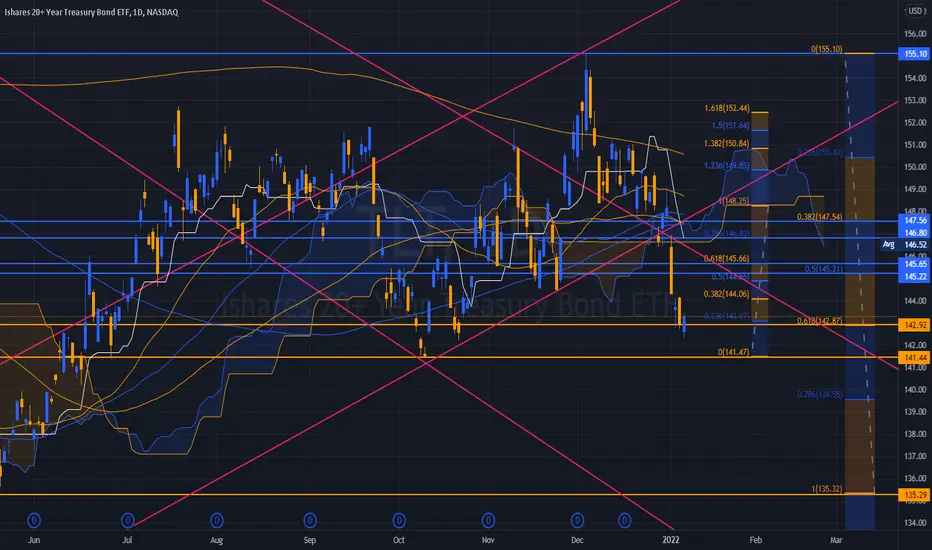
TLT - Daily / 3 Drives @ 149 and Fails
Currently the 10 Year Note Yield @ 1.725 -0.008 -0.47%.
What seemingly took a long time to begin to complete finally did.
__________________________________________________________
There is a great deal in the Wind with respect to TLT presently.
LArger Daily Gaps well below with Price Objectives extending to the
134 to 139 Levels - attendant Gap FIlls included.
It will depend on ZN's breakdown and whether Yeidls simply Sky to our
overhead Price Objectives 1.82 / 1.91 / 2.02 / 2.12 / 2.28 to 3.50
The Inflation Recalc will provide cover for a Retracement next week.
Exceeding the 2021 Highs will be a stark warning for the Bond Holders
who have been smoked for 1000 Bips in several Months.
Chasing Highs while the Inflation persistence was building in all Core
Data... generally unwise.
We have maintained that Wave 4 would be an Everything Must Go Sale.
SO far, so good, it's a THesis that time and again has proven to be correct
and how long it extends will depend on a number of factors.
We don't see a larger Equity Sell as supportive in a rising rate environment.
The SHort end of the Curve appears to be supportive as well.
_______________________________________________________________
McDonald's entered 2022 with 14.5% price increases across the Menu.
Big Mac's in Bonds give way to Filet o' Fish.
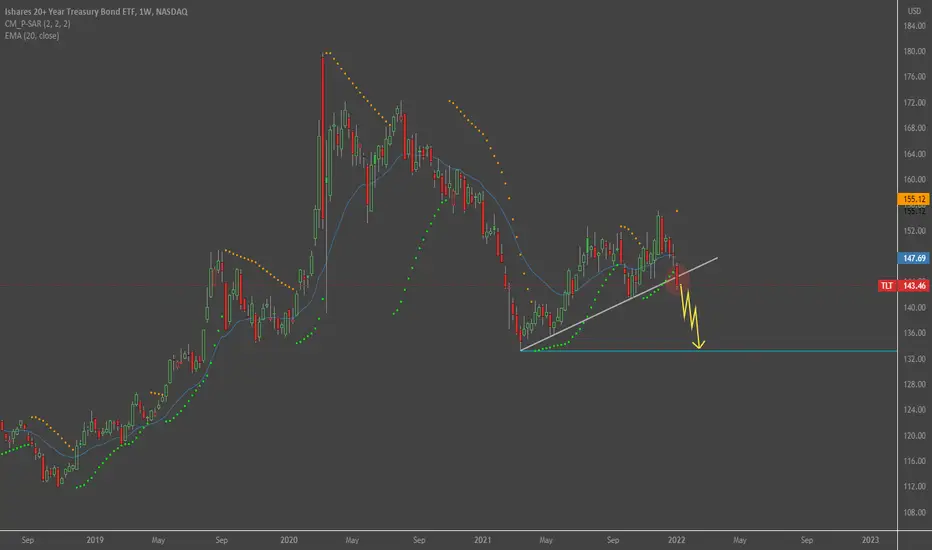
Rates UP, Bonds DOWNThe FED has and will be hawkish until (if ever) they get these markets under control and back to reasonable valuations. TLT has fallen out of its wedge and heading further to the downside. Mid-term target is $122 and possibly further as rates rise.
Not Financial Advice

$TLT selling off to $138-141 before rallying higherTLT looks to be close to finding a bottom. I could see TLT finding a bottom in the $138-141 range then basing for a couple of weeks before rallying higher in early November.
Key dates and levels on the chart.
My macro thesis is that we're at the start of a larger pullback in markets and money will flow to treasuries as a safety net. Dates align on both the S&P bottom and TLT top around March... Let's see how it plays out.

Interest Rates Rising - Short TLTTLT breaking down on weekly trend line as long term treasury rates spike. This could spill trouble to equity markets particularly high valued growth. Keep on eye on TLT or TNX.

TLT and MOVE Index, going in opposite directions soon?What is MOVE Index trying to tell us about TLT in the immediate future?

Pivots or Swing Highs and Lows- IPivots are essential in many forms of TA- including the TA i mainly use which is Action-Reaction aka pitchforks
Pivots may also be termed swing highs or lows
Pivots and swing highs/lows may be harder to define than one first imagines
I would define a pivot or swing as follows:
A focus of Price Action (PA) which becomes a reversal point
This is important because either a V shape or inverse V in PA does not equate with a pivot/swing
An acute angle in price may become a pivot or swing in hindsight IF it breaks the trend which price was previously moving along
G.R.I. Dec '21
KEY
P1 pivot one - price in uptrend along blue diagonal
P2- becomes a swing high WHEN blue diagonal is broken to the downside
P3- becomes a swing low WHEN yellow diagonal is broken to the upside
P4- becomes a swing high WHEN green diagonal is broken to the downside
P5- becomes a swing low WHEN pink diagonal is broken to the upside
P6- becomes a swing high WHEN purple diagonal is broken to the downside
P7- becomes a swing low WHEN green diagonal is broken to the upside

TLT - DailyRemarkable how poorly this has performed.
The 2 / 10 is causing some issues as there is a fear of contagion.
After $12 Trillion in Corporate Junk Issuance to BUY Shares in 2021...
Convention would lead one to assume UST's would be bid in greater size
and yet the Short end is now catching the attention as 2Yr's went off without
a hitch, No Fed, No Need.
The ISsue is the Long end of the Curve is eating itself as it believes Inflation
will be a persistent RISK.
Housing... another issue Globally.
___________________________________________________________________
ZB isn't wrong, nor are the Buyers on Strike with 3 back to back failed auctions.
TLT breaking the 50 with ZN Pointing South require a wait n' see position.
The AO has dipped into Negative territory... while the price struggles to hold.
Neagtive Divergeences abound.

BOndS ONly GO upThe blow off top will be cool
Lol
Simple chart
But if you're betting in inflation now you're betting against this
Welcome to a degrowth world
TRADE AT YOUR OWN RISK
G.R.I. Dec '21

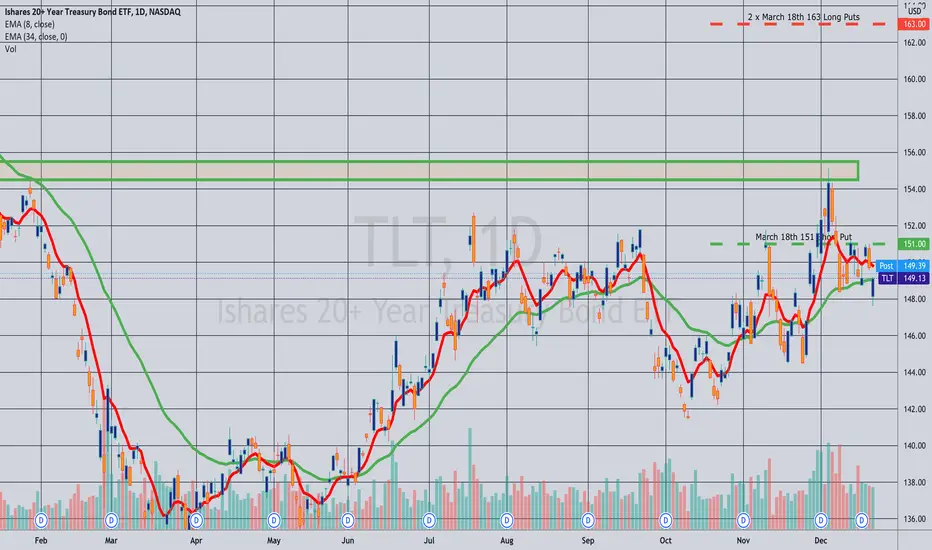
Closed: TLT March 18th 151/2 x 163 Ratio Backspread... for a 26.21 credit.
Comments: Filled this bearish assumption back ratio on TLT strength for 23.99 (See Post Below). Manually closed it today for a 26.21 credit; 2.22 ($222) profit; 9.3% ROC.
TLT Predicted Path (UGC)On the basis of previous ideas
I have switched to linear scale
And assuming the cycle low is in
This might be the path
NOT TRADING ADVICE

TLT Unified Global Charting '21-'25 CyclePlease see my previos UGC ideas
Using geometry, cycles, pivots and time
This is what i expect for TLT
For the next 3 years
NO ADVICE GIVEN TRADE AT YOUR OWN RISK

TLT: Unified Global ChartingIn this idea we analyse the TLT chart
From the perspective of
Time
Cycles
&
Geometry
TLT has been making 3/4 year cycles since the GFC
G.R.I. Dec '21

Unified Global Charting III: TimeFrom the GFC in 08/9 we can observe a circa 4 year cycle for TLT (high to high)
In this idea i plan to turn our attention to time
I have used the fibonacci time (trend based) tool to further subdivide this
Let's see what else time/cycle analysis can tell us about goverment bonds
G.R.I. Dec '21

Unified Global Charting: IIThis is the evolution of a charting concept based on time, pivots and price
We are looking at the 20+ year treasury bond ETF TLT as i think this is a vital chart for the coming decade
Here i have added in a 'mother' pitchfork off the three marked major pivots
I plan to add some analysis below
G.R.I Dec '21

Unified Global Charting I : Geometry And Time I have decided to share the evolution of this charting concept
It centres upon:
pivots
Geometry
TIME
Here we have the macro chart for TLT, a marker of risk on; and the bellwether for the 40 year bond bull market vs the current 'inflation' narrative
Here I have marked the major pivots and trendlines which relate to the cycles
