$spy $tlt Look for bonds to take out 152If bonds can take out 152 then there is an air pocket between 152-156 and you could see a very quick squeeze to 156. That would coincide with another drop in the market as well. At that point I am a seller of bonds and buyer of stocks. $spy may have another 2% downside.
If this is an inverted H&S then we could easily see top of volume range to 160 on tilt
TLT trade ideas

Opening: TLT March 18th 2 x 163/151 Back Ratio Spread... for a 23.99 debit.
Comments: Buying 2 x the 75 delta puts and selling the 50 delta put strike in the March expiry on strength here to create a synthetic -100 net delta short position with a 151.01 break even in 20+ year paper. Will start to look to take profit at 110% of what I put it on for.


Credit - TLT Long 2023Idea for TLT:
- According to consumer expectations, US is already in a recession. Dow hit ATH through this, so a headfake is due.
- We have been patient, but Treasury auction today is a good turning point.
- Long Jan 20, 2023 145C for 8.60 debit
GLHF
- DPT

TLT +.41% / While 20Yr @ High Yield of Month 2.06%Today's 20 Year Auction was sloppy and dangerous for Wood Panel FanBoys.
We released the Mastif's who chased Eddie Munster off our land.
Alexandra put a few 10 Gauge Triple Otts in Steve's BUttocks for good
measure.
Hopefully, this will suffice.
IF not - it's on to more persuasive actions. Alex adores the thought.
________________________________________________________________
www.treasury.gov
Bonds are seeing further FED Props.
Jit's Nasty out there for the 007s.
ZN is barely hanging on... Price Objective for ZN 129.55
Structure is Weakening
DOW at Session Lows.
Crude Dumpster Fire.
___________________________________________________
Bond Market Dislocations ahead.

TLT - WeeklyDivergences again for the Tilt - O - Whirl.
Just as the 007's were back to making 180 Hog Calls.
Signs, future signs, do not appear promising.
With a Failure to Break the Prior 152.71 Highs.
_____________________________________________
You have a large Bagel to contend with for now.
139s remain open as do 134s.

TLT - Prior Highs Held / No Trend Reversal Until Highs Exceeded007s should be on guard.
139s to 134s remain open.
Gaps Below, Gaps Above.
We believe the Lower Gaps will be filled 1st.
And why we are Sellers on Retracements.
_________________________________________
TNX + 1.017% @ 1.601

TLT still looks like a shortLooks like TLT can go down to $130 or potentially a bit lower, I would consider being a buyer at those levels, this also aligns up nicely with the price volume profile, general support area and the long term trend.

Closed: TLT January 21st 2 x 160/149 Put Ratio Backspread... for a 22.38 credit.
Comments: In for a 20.34 debit (See Post Below); out today for a 22.38 credit via a good until cancelled order to take profit at 110% of what I put the trade on for. 2.04 ($204) profit; 10% ROC for 5 days' "work."

TLT - ROCs @ Mid Curve007s have been back announcing the latest "Sure Thing"
in Scottish Moors.
Just bring back the Wood Paneling, please.
We would appreciate Steve leaving our Front Yard.
_______________________________________________
TLT has not closed over its recent Highs.
All Bets at the Flamingo's Roulette Wheel are on 33.
_______________________________________________
With the 2nd highest ROC in a few weeks @ +7.75%...
Sightings of "Wrong Way Conway" @ Gilligans Isle/
We'll Oppose - as when we hear Metal to Metal contact,
loud crunching sounds, glass breaking, blood, and bags
of Frito Lays strewn about...
Train Wreck.
TLT - Dip and then Ramp!See chart - C&H and Symmetrical triangle. Looking for Wave E down into a breakout move within the waves. PT 170/174 once complete.

Opening (Margin): TLT January 21st 2 x 160/149 Backratio Spread... for a 20.34 debit.
Comments: Buying 2 x the 82 delta strike and selling the at-the-money 49 delta strike for a setup with a net delta of -115, so this is going to move a lot like short stock. Going with the January expiry to give it more time to work out if it needs it, but will look to take profit at 110% of what I put the trade on for.

TLT Squeezing to stratosphereLike to thank somebody for pointing out the squeeze, but don't know the dude's name. Will likely dca into tlt shares over next 6 months or until squeezed. if anybody is thinking of following this trade just go check my other losses and maybe inverse this like dr. michael burry.

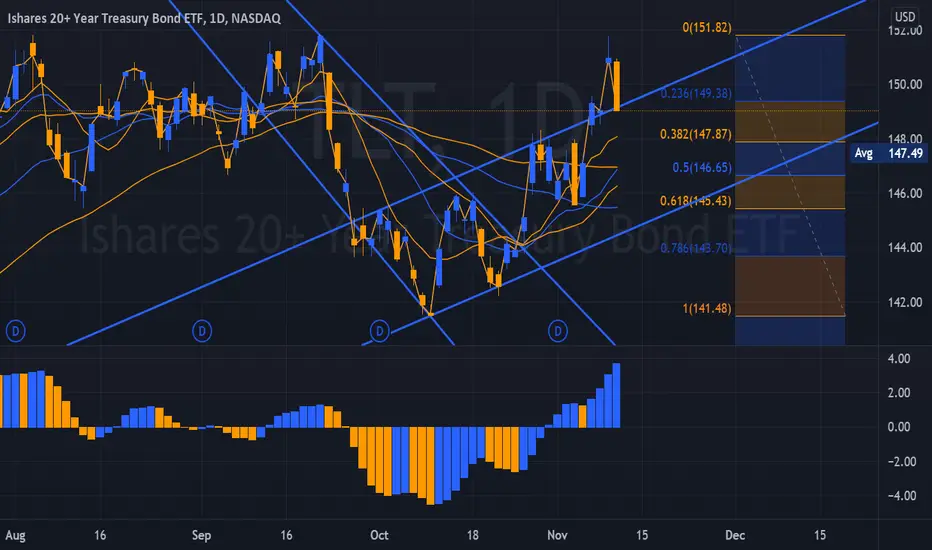
TLT, Trade and trend ranges [02NOV2021]So, in some of the previous plan's descriptions (link below) I have been saying about shorting TLT, and I thought today it would be nice to share a standalone TLT idea, please let me know how it goes.
Signal is extreme bearish, short term has an equal weights on upside to downside, and long term has a -3% downside. I will be adding puts to my core short positions today if I get TLT to be 147.5
PS. Each box span a day, and the code gives short term and long term trends as shown. the trend is shown with the color of the box. The range is calculated on a daily basis.
If you want similar ranges and trends on your ticker, feel free to contact me, I will add them to my list and provide them when the signal is interesting (for free of course)
Redd

Closed (IRA): TLT December 17th 147/2 x 154 Put Ratio Backspread... for a 14.00 debit.
Comments: Paid 12.48 to put this on during Friday's session. (See Post Below). Out today at the open for a 14.00 credit. 1.52 ($152) profit; 12.2% ROC for 3 days' "work."

DUMP COMING SOON ISH For all you nerds thinking that this is the top. I am sorry, but i would recommend putting in more effort. Your time will come:)

TLT - Beyond the Flamingo's Velvet RopesIn the Shadow of the Flamingo's Cheetah cordon, Casino Royale's Buy-In has begun.
A Global Game of Chance?
No.
Baccarat, amongst the Participants, is simply a matter of Bank / Player.
The Bank has a 2.5% edge.
Wealthy Participants are enjoying the "Vesper" - an elixir of extraordinary
mixology - Three measures of Gordon's, one of vodka, half a measure of Kina Lillet.
Fruit and Quinine - Ms. Kina, can be toxic if copious quantities are ingested.
_______________________________________
Insiders began pacing Out-Sized Put Bets on 007.
We have our next setup for TLT and are engaging it with a large SELL into the weak
retracement, which as indicated would fill those overhead Gaps.
Never run to the Baccarat Table, walk, saunter, swagger, swill a Kina in rhythm to stride.
Our Sells are neatly stacked within our several Racks, to be placed and pay the House Vig.
_______________________________________
Looking beyond the Velvet ropes - We are sellers again of Tilt-Lose-Tilt.
Perpetual Bonds with Negative Rates of Return... Playa Play played.
No time to die.
ps. spoiler - 007 Dies

Opening: TLT 2 x December 17th 154/147 Put Backspread Ratio... for a 12.48 debit.
Comments: Here, taking a short-term directional shot in treasuries on strength by buying 2 x the 75 delta puts in the December expiry and selling a 50 delta at-the-money put, yielding a -100.79 dynamic short delta position that will have the "feel" of being short a one lot in TLT from 147.76.
Will start to look to take profit at 110% of what I paid to put the trade on for.

TLT in a great uptrendyou have 3 things running for tlt
above trend line
double bottom
in over all buying territory

Simple Stupid TLT For youBonds have responded to federal reserve 'emergency measures' for a quick timeline:
1. qe on
2. qe should be going away narrative
3. qe is not going away
prediction
4. qe IS going away
Bought shares of bear bond 3X etf.

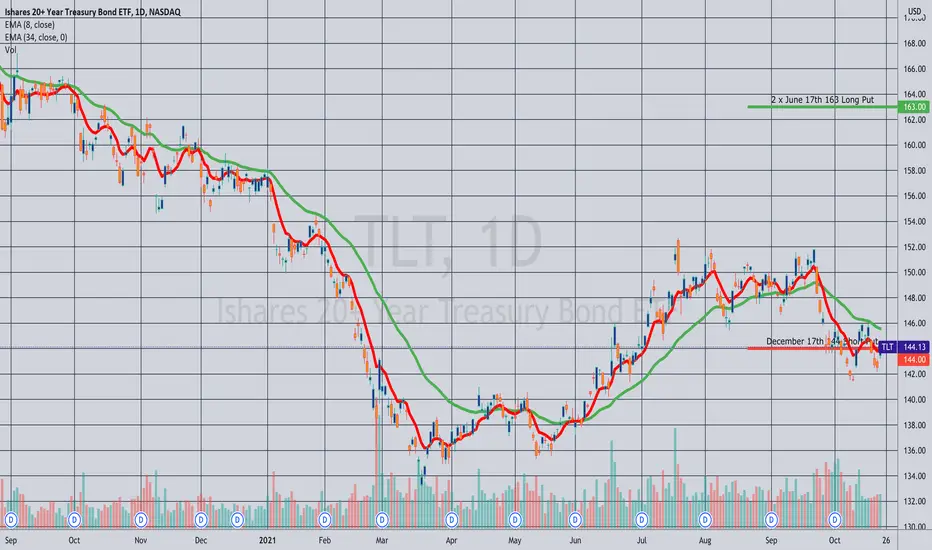
Trade Idea (TLT): Shorting 20+ Year Paper Via Ratio BackspreadA setup to take advantage of a potential rising interest rate environment without knowing exactly when rate hikes will occur.
Typically, this is set up by buying two of the back month 75 deltas and selling the front month 50 delta, such that you create a spread or diagonal with a net delta metric of around 100 (+100 if a bullish assumption spread or digaonal; -100 if bearish).
Here, I would buy the June 75 delta 163's, and sell the December at-the-money 144, resulting in a net delta of -101.65. With a buy-in of 40.81 at the mid ($4081), it isn't particularly cheap, but certainly cheaper than shorting 100 delta of TLT shares outright and with multiple opportunities to reduce cost basis by rolling out the short put aspect if a move isn't immediately forthcoming.
From a trade management standpoint I either (a) look to roll out the short put aspect to reduce cost basis further if the long put vertical aspect (i.e., one of the long put contracts + the short put aspect) of the setup doesn't converge on max; (b) look to take profit on the long put vertical aspect as soon as it converges on max and allow the remaining long put contract to either "ride" or cap it off by selling a short put against, creating a "new" long put diagonal.
Variations:
A long-dated, static long put vertical with lower net delta, specifically targeting 136:
TLT June 17th 136/155 Long Put Vertical (Buying the 155, Selling the 136)
Buying Power Effect: 10.78 ($1078)
Break Even: 144.22 vs. 144.13 (Friday's Close)
Delta: -33.62
Max Profit: 8.22 ($822)
TLT/JNK ratio signaling risk-on move coming along with VIX dropTLT (20 year bonds) / JNK (junk bonds - aka corporate riskier debt): Falling slope means Risk-On appetite for the market.

TLT - Opprotunity Approaching once againTLT is aimless, wandering the desert which is Bonds.
ZN has made new Lows for 2021 and continues to squat
over the 130 Level.
We believe it will fail as 10 Year Yields begin to complete
their Consolidation and cross the 1.645 Level - indicating
a move back to the 2021 Highs.
We will be entering a SELL on Shares only.
IV is not tempting enough at present as the Bond Bid has
been absent - today's 8AM EST resolution will provide far
more information for the larger trade here.
BUlls are eyeing the large Gaps overhead, believing they
are next.
We're not convinced they are correct, the 172s are a
which Implies Extreme Negative Returns.
Perpetual Bonds is al 007s will Clip while watching the
Capital Dissolve over time.
To each their very own.
