Opening (IRA): TLT October 18th 84 Short Put... for a .98 credit.
Comments: Laddering out at intervals at strikes between 85 and 82, assuming they're paying.
This is naturally longer-dated than most will want to go, but is part of a TLT position made up of covered calls (stock + short call) and short puts, so that I'm getting paid for (a) short call premium; (b) dividends; and (c) short put premium over time.
Alternatively, it's a "hmm, I really need to get more BP deployed here because I don't really have shit on at the moment" sort of thing ... .
TLT trade ideas

TLT long uptrendTlt that reflect basically usa bonds are in uptrend mainly due to future cut of rates in the usa! for moment its long!

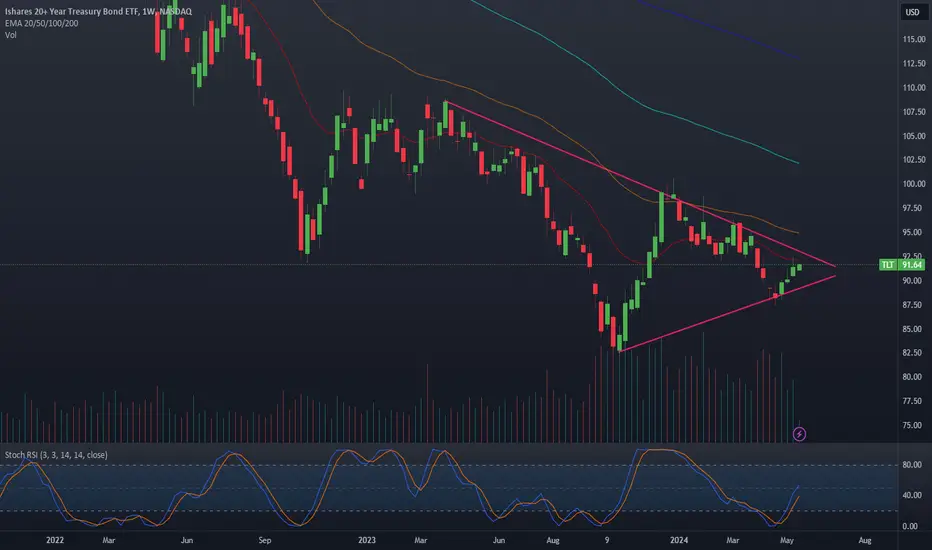
$TLT - Triangle breakout watch!NASDAQ:TLT A breakout from this triangle could send it to $108 - $110.👀

TLT 20The 20-year bond index, I see a price reversal and the beginning of a new ascending wave, as well as a positive divergence on the daily, weekly and monthly frames.

TLT in up trendTLT long term Treasury ETF closed the week higher than the 50 week moving average.
Also it is breaking out above a triangle trend line.
Weekly RSI shows a succession of higher swing lows.
I think this chart shows that TLT, having had a huge bear run over several years, has finally turned around.

$TLT iShares 20+ Year Treasury Bond -- The Wall of Jerome TLT 20y treasury bonds is down 50% from highs. I call this chart "The Wall of Jerome". Descending RED wall clearly shows the overhead resistance.
Once the United States starts it's interest rate cutting cycle, this wall breaks.
I think we're getting there, slowly, but surely.

TLT current levelsthese are the current levels of TLT as they stand today with a bit of a curve instilled for illustrative purposes that may make the chart track as it would have before the invention of all that is good and just but before the one comes back to see his creation

Trade Like A Sniper - Episode 23 - TLT - (7th June 2024)This video is part of a video series where I backtest a specific asset using the TradingView Replay function, and perform a top-down analysis using ICT's Concepts in order to frame ONE high-probability setup. I choose a random point of time to replay, and begin to work my way down the timeframes. Trading like a sniper is not about entries with no drawdown. It is about careful planning, discipline, and taking your shot at the right time in the best of conditions.
A couple of things to note:
- I cannot see news events.
- I cannot change timeframes without affecting my bias due to higher-timeframe candles revealing its entire range.
- I cannot go to a very low timeframe due to the limit in amount of replayed candlesticks
In this session I will be analyzing Ishares 20+ Treasure Bond ETF (TLT), starting from the 6-Month chart. (For some reasons I read "Ishares" as "Israeli" XD.

The easiest money you can earn in 3 months!fundamental analysis of TLT suggests that the ETF's performance in 2024 will depend heavily on the direction of interest rates, inflation, and economic conditions. Investors considering TLT should carefully assess these factors and their risk tolerance before making an investment decision.

Hold onto your hamburgers NASDAQ:TLT : major turning point?
#us10y #gold #silver #dxy
Channel breakout on a daily close, line chart basis.

Market Update 5/25/2024Going through the usual stuff, my portfolio, performance, losses, mistakes, good trades, lessons learned and opinions for the next weeks. First time I make it public though and I plan to keep doing it weekly

Opening (IRA): TLT September 20th 83 Short Put... for a 1.08 credit.
Comments: Targeting the 52-week low here with a rung out in September (I've already got rungs on in April, May, June, etc.), which I think is unlikely to be touched in light of talk about the Fed cutting rates ... at some point in time.
Naturally, if I'm wrong, I'm also fine with picking up shares at a cost basis below the covered call setup I currently have on ... .

TLT wedgeTLT presents a wedge on a rising trend, this is bullish for risk on markets. As inflation remains sticky any report of easing inflation will cause TLT to break through this to the upside. Remember that if 20 year bonds rise, this helps alleviate the yield curve and drop shorter-dated bonds, this reduces overall interest rates. In a healthy market, longer-dated bonds should always provide more yield than monthlies, this is not the case for the last year plus because of the yield curve inversion.
-Late June or July this wedge breaks to the upside
-Rate cuts will follow
-Either the market pumps into elections hard, or we start to go into a recession
-I believe Biden will not allow a recession until 2025 due to elections
The Traditional 60/40 Portfolio ReimaginedThis is a snipet of a more extensive note on themacrobrief.substack.com
This trend of central banks accumulating higher gold reserves also holds true on a global basis.
This has huge implications for investors as foreign central banks hold lower US Treasury reserves vs higher gold reserves , it puts upwards pressure on US yields (Lower bond prices) and creates demand for gold resulting in higher gold prices.
The Macro Brief is a reader-supported publication. To receive new posts and support my work, consider becoming a free or paid subscriber.
Traditional 60/40 portfolios are likely to suffer if this trend of replacing US Treasury reserves with gold continues.
Traditional 60/40 vs Modern 60/40 vs 60/20/20 Stocks, Bonds & Gold
Below are the results for a monthly investment strategy investing $250 a month from 1984 to today in both the traditional 60/40 stocks and bonds vs modern 60/40 stocks and gold and also a balanced approach which has 60/20/20 stocks, bonds and gold. The portfolio is rebalanced yearly.
The tailwind in bonds from a 40 year decline in interest rates contributed to long periods of outperformance for the traditional 60/40 portfolio, however the other two portfolios of modern 60/40 and 60/20/20 both produced marginally better performance.
Given the macro landscape developing from central banking behaviour and the uncertainty of inflation, interest rates, we could be entering a period where the modern 60/40 produces long periods of outperformance. Considering an allocation which diversifies bond holdings with gold could offer a lifeline for the traditional 60/40 and better prepare investors' portfolios to navigate the road ahead.
Whilst the traditional 60/40 stocks and bonds portfolio has been the portfolio of choice for the global trends of the last 40 years, the trends emerging for the decades ahead especially the reduction of foreign central bank holdings of US treasuries and the accumulation of gold as part of their balance sheet means that investors portfolios stand to benefit a great deal by considering a switch from the traditional 60/40 models, with the most likely beneficiary being gold.
Stay tuned for more insights on financial strategies, market trends and macro insights from The Macro Brief.

TLT Is Coming Into Key Support Within A Corrective DeclineTreasury bond TLT has been trading lower since the start of 2024, but after an impulsive rally at the end of 2023, we believe it's just making and finishing a deep A-B-C corrective decline. It's actually now coming into key strong support zone at 61,8% - 78,6% Fibo. retracement and channel support line, from where we should be aware of bounce, recovery and continuation higher back to 2024 highs. Just keep in mind that bullish confirmation is only above channel resistance line near 92.00 region, while invalidation level remains at 82.45.

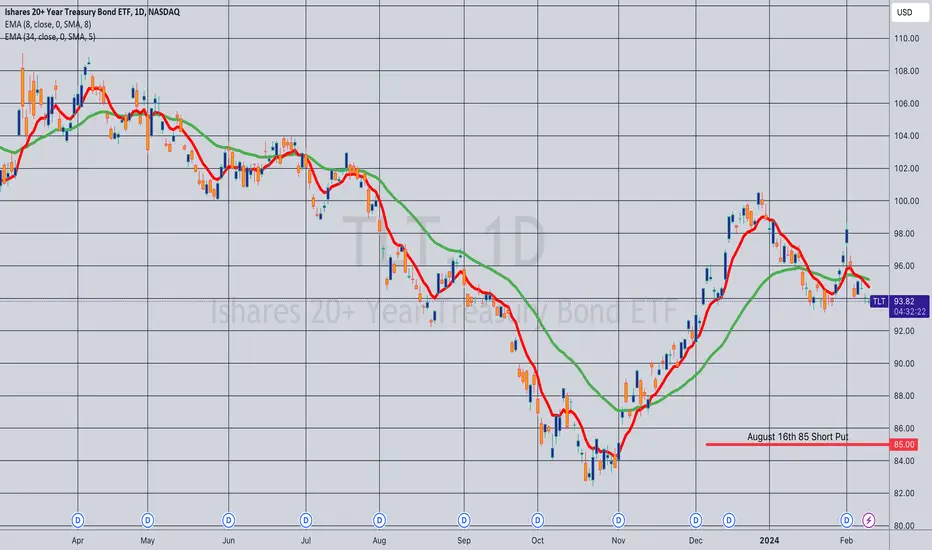
Opening (IRA): TLT August 16th 85 Short Put... for a .98 credit.
Comments: Targeting the strike paying around 1% of the strike price in credit, adding to my position at intervals, assuming I can get in at strikes better than what I currently have on.
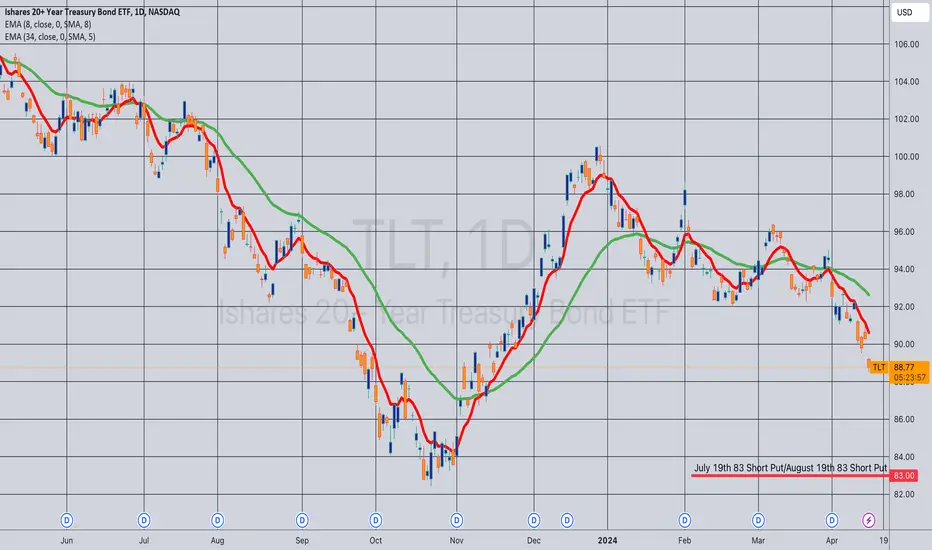
Opening (IRA): TLT July 19th 83/August 16th 83 Short PutsComments: Getting in at strikes better than what I currently have on in July and August.
July 19th 83: Filled for an .85 credit
August 16th 83: Filled for a 1.11 credit
I'm fine with potentially getting assigned with shares at 83, since they're way below the cost basis of the covered calls I currently have on. I knew this might end up being a very, very long duration trade that would potentially take time to work out, but ... yeesh, the weakness.
Will look to roll out the most at risk strikes I've got in July (at the 86) and August (at the 85) at some point ... .
Wedge Forming on BondsThis is a follow up to my previous post about NASDAQ:TLT and AMEX:TMF showing also backing my thesis from a more technical level.
I really think this is one of the best risk rewards on the market at this time and also acts as a hedge against stocks if we get bad market news

BONDS ARE THE WAYRight now rates have probably peaked or are close to peaking
I strongly believe vehicles like NASDAQ:TLT or AMEX:TMF provide some of the best risk reward for a long swing trade for the next few months. TLT is especially attractive due to its Yield being over 4% at this time.
If any fear of recession comes into play over the next year these trades will fly. Although you could buy calls I think holding the ETF is the trade since the yield is there for those who simply hold long. I also prefer TMF for large percentage gain since it removes the worry of Theta decay and allows you to average into a position over time.
Happy trading!

Weak Jobs Report -> Treasury RallyTLT long term bond ETF ripe for a swing trade to $92 coming off the
1. Hard landing concerns -> Treasury Bond Rally (TLT)
2. Faster Fed Rate cuts -> Treasury Bond Rally (TLT)
3. Inflation Dropping -> Treasury Bond Rally (TLT)

Very nice set upHere's a set up that will be meaningful: NASDAQ:TLT breaking out through the downtrend AND weekly EMA30.
The area to watch in the green box 👁️✍️

Opening (IRA): TLT July 19th 86 Short Put... for a .98 credit.
Comments: Adding to my TLT position on weakness here, targeting the strike paying around 1% of the strike price in credit.
I already have rungs on in April/May/June, so am adding a smidge out in July.
With QQQ and SPY knocking on ATH's, holding off on my usual broad market plays to await weakness and/or higher IV.

Contrarian PlayAlot of chatter about bonds breaking upward.
But I'm thinking there may a short term bounce
on the tlt -
Looking at May 10 $89 - $89.5 - $90 Calls
Lotto contrarian play - Ill see what they do in the morning
