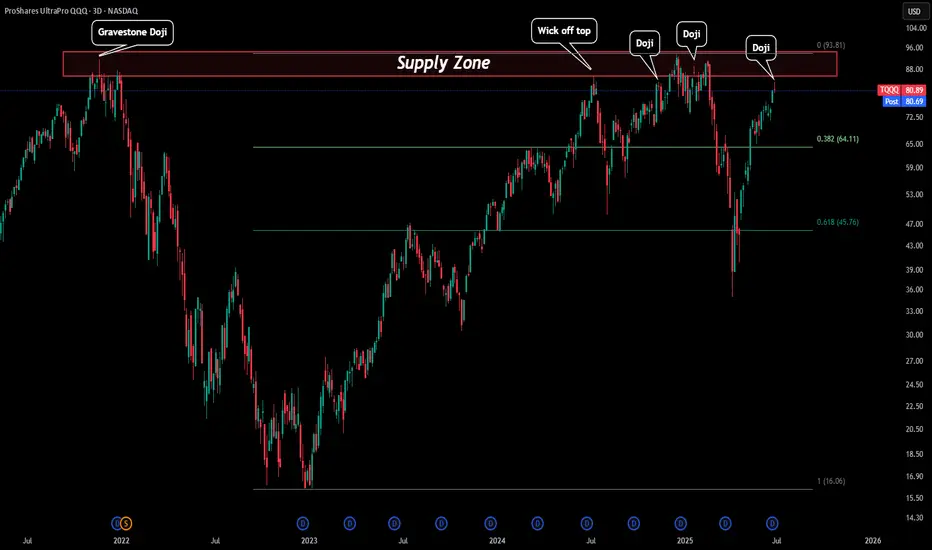
TQQQ - Red Days Ahead?TQQQ just created a 3D doji. The reason this is important is everytime we have seen reversal candles close to or in our red box (Supply zone) usually we see selloffs follow.
Price came very close to the red box and created a 3D reversal doji that could signal some downside price action. If this is to occur the first level to watch would be our 0.382 Fibonacci level around $65.
TQQQ trade ideas
$TQQQ - $78 ishHey guys, the AI helped me ride the wayve from 68 all the way to 76. With a small pullback the AI says we'll see something around the range of 77.5 ish, closer to 78 quite soon.
Would buy all opporutnites below the 75 range. Anything below 72.5 is a crazy buy and anything below $70 for the moment means one asks their relatives for a small loan of 1 billion dollars for a quick investment.
Will be sharing the AI with the public once it's ready for public consumption.

$TQQQ Weirdly mildly bullishDon't understand why, don't care. My AI gave of a partial bullishness signal for tomorrow onwards for TQQQ. It believes this a buy the dip moment (Unless it changes it's mind for whatever reason).
This is a signal on 3 out of 16 of my 3.6 sharpe models which is fairly bullish. I also had a UVXY call buy suggestion for today which i acted on which weirdly worked out intraday.
Expected move is around ~$4-7 dollars up, more likely on the lower end of that but i can't be sure. All i know is that the AI says up so i'm in.
I've dipped my feet a bit at these levels and waiting for more of my models to say BUY before i fully dip in. Several other tickers like CVNA and MARA flashed BUY today as well which is a nice extra confirmation, but not as good as if all 16 of my TQQQ models flash BUY which they haven't yet.

$TQQQ - Small moonThe AI has been triggered on TQQQ and UVXY. Calls on TQQQ and puts on UVXY.
The models i have on these have a sharpe of around 3.4-3.6 which means these are almost guaranteed money making trades as long as your entry point is good.
I'm waiting for confirmation before i go in but i'm likely to enter this trade really hard. The AI suggests ITM Calls at around 57.5 and 60 a month out. You can trade QQQ for this as well for similar equivalent strikes and expiries.

TQQQ Day Trade Plan for 04/29/2025TQQQ Day Trade Plan for 04/29/2025
📈 55.10 55.60
📉 52.10 51.60
Thanks to all my followers! Truly appreciate the support!
Please like and share for more ES/NQ levels Tues & Thurs 🤓📈📉🎯💰
*These levels are derived from comprehensive backtesting and research and a quantitative system demonstrating high accuracy. This statistical foundation suggests that price movements are likely to exceed initial estimates.*

NASDAQ Long Term: Deep in Bear MarketAn indicator works until it does not.
The SMA256 on the DAY chart of NASDAQ (QQQ/TQQQ) )has been respected multiple times as both supports and resistances since the end of COVID bullish run starting 2022.
For long-term trend-following traders, this chart shows we are now deep in the bear market (trend reversal happened in early March), stop placing long positions until the next trend reversal is clear.

Opening (IRA): TQQQ April 4th 70 Covered Call... for a 68.05 debit.
Comments: Starter position in the first weekly in April ... .
Metrics:
Buying Power Effect/Break Even: 68.05
Max Profit: 1.95
ROC at Max: 2.87%
50% Max: .98
ROC at 50% Max: 1.44%
Will generally look to take profit at 50% max, add at intervals assuming I can get in at strikes better than what I currently have on, and/or roll out short call if my take profit is not hit.

Opening (IRA): TQQQ April 17th 60 Covered Call... for a 57.91 debit.
Comments: Adding at strikes better than what I currently have on ... . Here, going lower net delta by selling the -84 call against shares to emulate the delta metrics of a 2 x expected move 16 delta short put, but with the built-in defense of the short call.
Metrics:
Buying Power Effect/Break Even: 57.91/share
Max Profit: 2.09
ROC at Max: 3.61%
50% Max: 1.05
ROC at 50% Max: 1.82%
Will generally look to take profit at 50% max, add at intervals if I can get in at strikes better than what I currently have on, and/or roll out short call if my take profit is not hit.

Buy and Sell zones for TQQQ Showing Same Sell Signals as SP500
TQQQ buy and sell zones showing in green and red. Yellow is where there is likely to be chop. The monthly starts to give clarity and confirmation of the key tend breaks and the appropriate response from the market this week.
These sell zones correlate nicely with the SP500. I would add to my shorts around Thursday and SP500 Friday's highs.

Short-Term Gamble on a NASDAQ Bounce Using TQQQIn this quick update, I’m taking a speculative short-term trade on a possible NASDAQ recovery after a steep sell-off. Was the market oversold—at least for a day? Maybe. Do I think the pain is over for the longer term? Probably not.
I’m using NASDAQ:TQQQ , a 3x leveraged ETF that tracks the NASDAQ-100 (the top 100 non-financial stocks in the NASDAQ). This means if the index moves up 2%, TQQQ should theoretically gain roughly 6%, and vice versa on the downside. Leveraged ETFs like this are high-risk, time-sensitive instruments—they’re designed for short-term trades, not buy-and-hold investing.
The idea here is that after a sharp drop, institutions might step in to scoop up oversold tech stocks, creating a brief rebound. If that happens, TQQQ could give me amplified upside. But this is purely a gamble—I’m under no illusion that the market has bottomed. In fact, I expect more downside ahead.
I entered in the after-hours session once some of the heavy bearish volume faded, and I’ve set a tight 5% stop-loss to manage risk. Yes, I could get shaken out by an early dip before any rebound, but the stop is there to protect me if the sell-off continues.
This is a high-risk, short-term trade—buyer beware. If you’re considering TQQQ, understand the risks: decay from daily resetting leverage, extreme volatility, and the potential for rapid losses.
I’ll update on how this plays out. Wish me luck in the comments below 😁
Real question is where to take profit...

Opening (IRA): TQQQ May 16th 51 Covered Call... for a 48.05 credit.
Comments: Adding at a strike better than what I currently have on, selling the -75 delta call against shares to emulate the delta metrics of a 25 delta short put, but with the built-in defense of the short call.
Metrics:
Buying Power Effect/Break Even: 48.05
Max Profit: 2.95
ROC at Max: 6.14%
50% Max: 1.48%
ROC at 50% Max: 3.07%
Will generally look to take profit at 50% max, add at intervals if I can get in at strikes better than what I currently have on, and/or roll out short call at 50% max.

TQQQ Stock Chart Fibonacci Analysis 032225Trading Idea
1) Find a FIBO slingshot
2) Check FIBO 61.80% level
3) Entry Point > 59/61.80%
Chart time frame: B
A) 15 min(1W-3M)
B) 1 hr(3M-6M)
C) 4 hr(6M-1year)
D) 1 day(1-3years)
Stock progress: C
A) Keep rising over 61.80% resistance
B) 61.80% resistance
C) 61.80% support
D) Hit the bottom
E) Hit the top
Stocks rise as they rise from support and fall from resistance. Our goal is to find a low support point and enter. It can be referred to as buying at the pullback point. The pullback point can be found with a Fibonacci extension of 61.80%. This is a step to find entry level. 1) Find a triangle (Fibonacci Speed Fan Line) that connects the high (resistance) and low (support) points of the stock in progress, where it is continuously expressed as a Slingshot, 2) and create a Fibonacci extension level for the first rising wave from the start point of slingshot pattern.
When the current price goes over 61.80% level , that can be a good entry point, especially if the SMA 100 and 200 curves are gathered together at 61.80%, it is a very good entry point.
As a great help, tradingview provides these Fibonacci speed fan lines and extension levels with ease. So if you use the Fibonacci fan line, the extension level, and the SMA 100/200 curve well, you can find an entry point for the stock market. At least you have to enter at this low point to avoid trading failure, and if you are skilled at entering this low point, with fibonacci6180 technique, your reading skill to chart will be greatly improved.
If you want to do day trading, please set the time frame to 5 minutes or 15 minutes, and you will see many of the low point of rising stocks.
If want to prefer long term range trading, you can set the time frame to 1 hr or 1 day.

TQQQ stock Chart Fibonacci Analysis 031725Trading Idea
1) Find a FIBO slingshot
2) Check FIBO 61.80% level
3) Entry Point > 59/161.80%
Chart time frame: B
A) 15 min(1W-3M)
B) 1 hr(3M-6M)
C) 4 hr(6M-1year)
D) 1 day(1-3years)
Stock progress: A
A) Keep rising over 61.80% resistance
B) 61.80% resistance
C) 61.80% support
D) Hit the bottom
E) Hit the top
Stocks rise as they rise from support and fall from resistance. Our goal is to find a low support point and enter. It can be referred to as buying at the pullback point. The pullback point can be found with a Fibonacci extension of 61.80%. This is a step to find entry level. 1) Find a triangle (Fibonacci Speed Fan Line) that connects the high (resistance) and low (support) points of the stock in progress, where it is continuously expressed as a Slingshot, 2) and create a Fibonacci extension level for the first rising wave from the start point of slingshot pattern.
When the current price goes over 61.80% level , that can be a good entry point, especially if the SMA 100 and 200 curves are gathered together at 61.80%, it is a very good entry point.
As a great help, tradingview provides these Fibonacci speed fan lines and extension levels with ease. So if you use the Fibonacci fan line, the extension level, and the SMA 100/200 curve well, you can find an entry point for the stock market. At least you have to enter at this low point to avoid trading failure, and if you are skilled at entering this low point, with fibonacci6180 technique, your reading skill to chart will be greatly improved.
If you want to do day trading, please set the time frame to 5 minutes or 15 minutes, and you will see many of the low point of rising stocks.
If want to prefer long term range trading, you can set the time frame to 1 hr or 1 day.

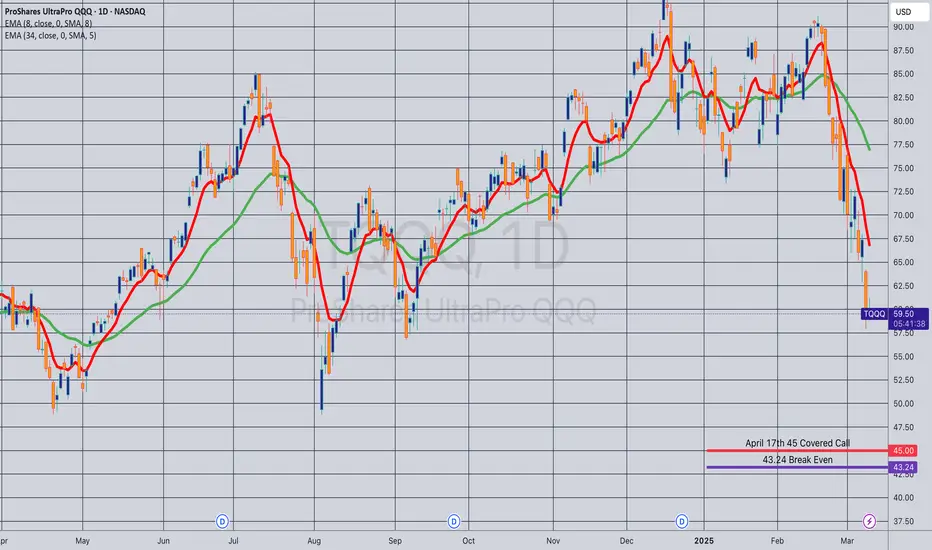
Opening (IRA): TQQQ April 17th 45 Covered Call... for a 43.24 debit.
Comments: Adding to my position at break evens better than what I currently have on, but going a little bit less aggressive net delta-wise, selling the -84 delta call against shares to emulate the delta metrics of a 2 x expected move short put, but with the built-in defense of the short call.
Metrics:
Buying Power Effect/Break Even: 43.24
Max Profit: 1.76
ROC at Max: 4.07%
50% Max: .88
ROC at 50% Max: 2.04%
Will generally look to take profit at 50% max, add at intervals if I can get in at break evens better than what I currently have on, and/or roll out short call if my take profit is not hit.
TQQQ. Did we just find a top ?Did we find a top in the stock market ? Will the bulls be able to reclaim their support line ? Let's see !
www.tradingview.com

TQQQ found it's direction today?Going for a mid-day win with TQQQ up to the midpoint of the fan wedge.

TQQQ Stock Chart Fibonacci Analysys 030825 Trading Idea
1) Find a FIBO slingshot
2) Check FIBO 61.80% level
3) Entry Point > 68.2/61.80%
Chart time frame: B
A) 15 min(1W-3M)
B) 1 hr(3M-6M)
C) 4 hr(6M-1year)
D) 1 day(1-3years)
Stock progress: A
A) Keep rising over 61.80% resistance
B) 61.80% resistance
C) 61.80% support
D) Hit the bottom
E) Hit the top
Stocks rise as they rise from support and fall from resistance. Our goal is to find a low support point and enter. It can be referred to as buying at the pullback point. The pullback point can be found with a Fibonacci extension of 61.80%. This is a step to find entry level. 1) Find a triangle (Fibonacci Speed Fan Line) that connects the high (resistance) and low (support) points of the stock in progress, where it is continuously expressed as a Slingshot, 2) and create a Fibonacci extension level for the first rising wave from the start point of slingshot pattern.
When the current price goes over 61.80% level , that can be a good entry point, especially if the SMA 100 and 200 curves are gathered together at 61.80%, it is a very good entry point.
As a great help, tradingview provides these Fibonacci speed fan lines and extension levels with ease. So if you use the Fibonacci fan line, the extension level, and the SMA 100/200 curve well, you can find an entry point for the stock market. At least you have to enter at this low point to avoid trading failure, and if you are skilled at entering this low point, with fibonacci6180 technique, your reading skill to chart will be greatly improved.
If you want to do day trading, please set the time frame to 5 minutes or 15 minutes, and you will see many of the low point of rising stocks.
If want to prefer long term range trading, you can set the time frame to 1 hr or 1 day.

TQQQ Stock Chart Fibonacci Analysis 030625Trading Idea
1) Find a FIBO slingshot
2) Check FIBO 61.80% level
3) Entry Point > 68/61.80%
Chart time frame: B
A) 15 min(1W-3M)
B) 1 hr(3M-6M)
C) 4 hr(6M-1year)
D) 1 day(1-3years)
Stock progress: B
A) Keep rising over 61.80% resistance
B) 61.80% resistance
C) 61.80% support
D) Hit the bottom
E) Hit the top
Stocks rise as they rise from support and fall from resistance. Our goal is to find a low support point and enter. It can be referred to as buying at the pullback point. The pullback point can be found with a Fibonacci extension of 61.80%. This is a step to find entry level. 1) Find a triangle (Fibonacci Speed Fan Line) that connects the high (resistance) and low (support) points of the stock in progress, where it is continuously expressed as a Slingshot, 2) and create a Fibonacci extension level for the first rising wave from the start point of slingshot pattern.
When the current price goes over 61.80% level , that can be a good entry point, especially if the SMA 100 and 200 curves are gathered together at 61.80%, it is a very good entry point.
As a great help, tradingview provides these Fibonacci speed fan lines and extension levels with ease. So if you use the Fibonacci fan line, the extension level, and the SMA 100/200 curve well, you can find an entry point for the stock market. At least you have to enter at this low point to avoid trading failure, and if you are skilled at entering this low point, with fibonacci6180 technique, your reading skill to chart will be greatly improved.
If you want to do day trading, please set the time frame to 5 minutes or 15 minutes, and you will see many of the low point of rising stocks.
If want to prefer long term range trading, you can set the time frame to 1 hr or 1 day.

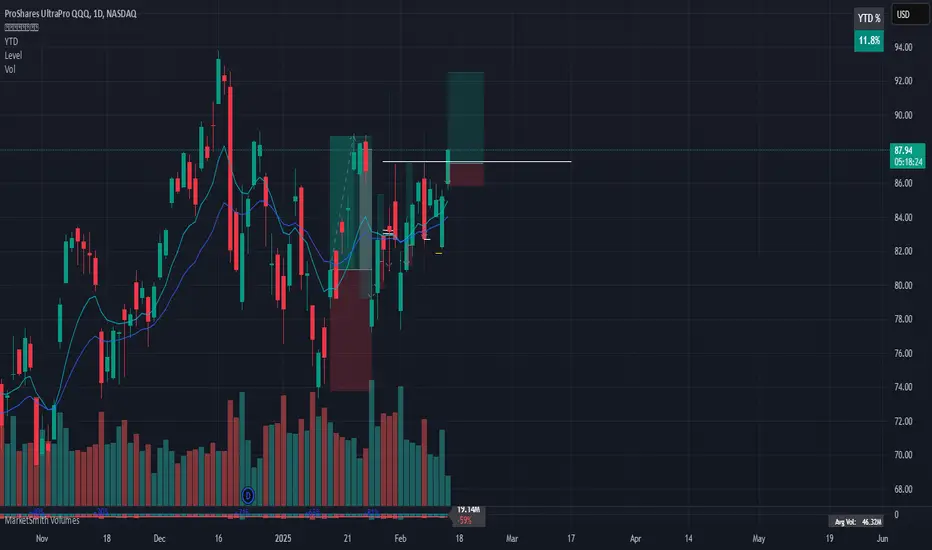
Tech should be sold like no other right nowIf the recent mass layoffs and stock buy backs in the tech industry have not been a good indicator for you yet let this chart serve as one: NASDAQ:TQQQ is going down and it will be swift and soon. The triple qs is not only extremely extended but volume for the overall index is currently falling off a cliff, suggesting there is much lower buying interest than it really seems for this index which in the context of bond yields and money market returns rising makes sense. All I can further say is that retail inflows into the tech sector is at an all-time high as of last week's dip AND YET THE OVERALL BUYING VOLUME IS DECREASING simultaneously. That means it is extremely likely institutions en mass are tapering off investment and rotating out which will make the selling sooo much worse once it initially begins in earnest.

$TQQQ Cup & handle possible on weeklyI bought a few calls for March opex, chart looks to me like a cup full of cocoa with a marshmallow floating in the middle. Handle might be in on this dip today, we shall see!

Opening (IRA): TQQQ March 21st 69 Covered Call... for a 67.07 debit
Comments: Not finished with March yet ... . Taking less risk here than I would ordinarily do to give me more room to be wrong, selling the -84 delta call against shares to emulate the delta metrics of a 16 delta short put, but with the built-in defense of the short call.
Metrics:
Buying Power Effect/Break Even: 67.07 debit
Max Profit: 1.93
ROC at Max: 2.88%
50% Max: .97
ROC at 50% Max: 1.44%
Will generally look to take profit at 50% max, add at intervals if I can get in at break evens better than what I currently have on, and/or roll out my short call if my take profit is not hit.

TQQQ - LONGIn TQQQ - 5 m opening range high close above bought .
will update trade management on comments ....
Opening (IRA): TQQQ March 21st 72 Covered Call... for a 68.95 debit.
Comments: Starter position on weakness. Selling the -75 delta call against shares to emulate the delta metrics of a 25 delta short put, but with the built-in defense of the short call.
Metrics:
Buying Power Effect/Break Even: 68.95
Max Profit: 3.05
ROC at Max: 4.42%
50% Max: 1.53
ROC at 50% Max: 2.21%
Will generally look to take profit at 50% max, add at intervals, assuming I can get in at strikes/break evens that what I have on at the time, and/or roll out short call if my take profit is not hit.
