TQQQ , LONG ( Swing account ) End of day entry on same price action but only much smaller size than earlier attempt
*took out prior two lower highs and 50 sma takeback
Entry - 28.49
Stop - 26.59
PT1 - sell 1/4 at 1R , raise stop to half risk
PT2 - sell 1/4 at 2R
then trend follow balance and add when applicable
Risk to account 0.5%
TQQQ trade ideas

TQQQ , LONG ( TFSA ACCOUNT ) This is a slower account that I am using a portion of my TFSA for , the backtest method is to sell 1/3rd at 2R but I am changing this to get more proactive on taking profits , this is its second trade of 2022 and my first trade was a loser but honestly should not have been . The stop was too far imo and I still had a 2R de-risk point .
So , I am doing something similar to my swing account and having a 1R and 2R profit target but instead of selling 1/4 , I am going to sell 1/6 each time . This way a fully de-risked position will still leave me with 2/3rds of my shares . This account focuses entirely on TQQQ that's all it trades and in a good environment it can compound pretty nicely . It is back tested quite extensively , where I manually go over the chart to log the data and compiled about 12 years worth of trades and various different trade management structures , one thing worth noting is that the TQQQ had lots of periods where it made all time highs though these 12 years and I have not tested it through long periods of market underperformance . However , just the same with my swing account , this is precisely why we de risk or at least try to ;)
It has had periods in the last 12 years of data where I have had 6 losers in a row , 5 is more common . Largest amount of winners in a row is 7 .
There is not a huge amount of difference between this TQQQ TFSA account vs my swing account but it takes way less trades and takes much heavier positions , I originally used the whole account to take a position but I have since changed this to 3% risk vs AUM because I know the most lost trade in a row was 6 . So based on the last 12 years , that's a max 12 % account drawdown which is pushing the limits of where the math of what it takes to recover starts to work against you .
Ok so there is a quick explainer of why I have so many TQQQ trades of late lol , I like TQQQ ~
Oh yea , I am pretty sure that a TFSA account is similar to IRA for us Canadians btw for those wondering ...
Entry - 28.43
Stop - 26.57
PT1 -30.31, sell 1/6 , raise stop
Pt2 - 32.18, sell 1/6 , stop same
run balance ..

TQQQ to 35Two Ways I want to play this move if it happens
1) I expect until Wednesday 7/27 that we are going to remain balanced between roughly 27 to 32
IF we get that clean break to the upside hard and fast (giggity) then I want to be looking to play that 35 to 36 rejection short. I am likely to swing this move, maybe day trade! but I will have to see what its looking like if it sets up. Leaning more towards a swing trade over next day or two
2) I want below 28.57 to pick up my first long entry. If we dip to 26 I will add once more to swing the contracts into that 35 short entry I am targeting
This is only IF we set up with price holding that 26 to 27 area of support. If that is broken and held below this plan is invalid as the overall market is going lower and shorts to the downside would be in play at that point

TQQQSince this short reversal I set up a breakout to the next trend level up. I set an additional correction at the top range to retest the new point of control. Seeing how this plays out. Enjoy

its time to talk about an intermediate or longer term bottomthis ideais simple. if we hold $20, we will break above $56.89 closing the gap left over from april 4th. what could be better? the doomsayers and prognosticators are all pointing toward recession, but where do you see the pain? its all in the past, and the worst may be behind us. only time will tell, but if this face ripper of a rally continues, bears will be trapped and tutes, mm, smart money will be long (if they arent already).

TQQQ and Market BottomMACD & RSI crossed up on a weekly, price action confirms reversal, long till resistance!

TQQQ , LONGTaking an early position here in an attempt to acquire more shares while respecting normal risk with 50 ma as a line in sand for risk .
We are very early here but the difference in shares for a position with stop vs 50 compared to LOD is considerable and if this move up works we should stay above the 50 ma too ...
Pros are that we made it above prior 2 lower highs , which I would say is huge if we can get some follow through .
We also made it above the 50 ma on QQQ but now also on TQQQ now which was lagging...
Cons is lower volume on indices , as I write we are below average relative vol on both spy and qqq .
But still , price is king and maybe we might see a later day volume surge to confirm things ..
Entry 28.49
Stop 27.98
PT1 - sell 1/4, stop half risk
PT2 - sell 1/4, stop same
End of day , may have to adjust position size smaller and modify order based on where we wind up , am over sized for a swing , completely acceptable for an early entry though and risk is only still 0.5% vs AUM , that's very important here .

TQQQ , SHORT ( but immediately out in aftermarket for tiny loss)Almost did not share this and it's kind of pointless because I made the choice to exit it immediately in am .
But then I figured that since I have made a point out of posting every single 2022 trade in swing account , that I should still post and explain my logic here. I almost kept it on but here's why I just got out .
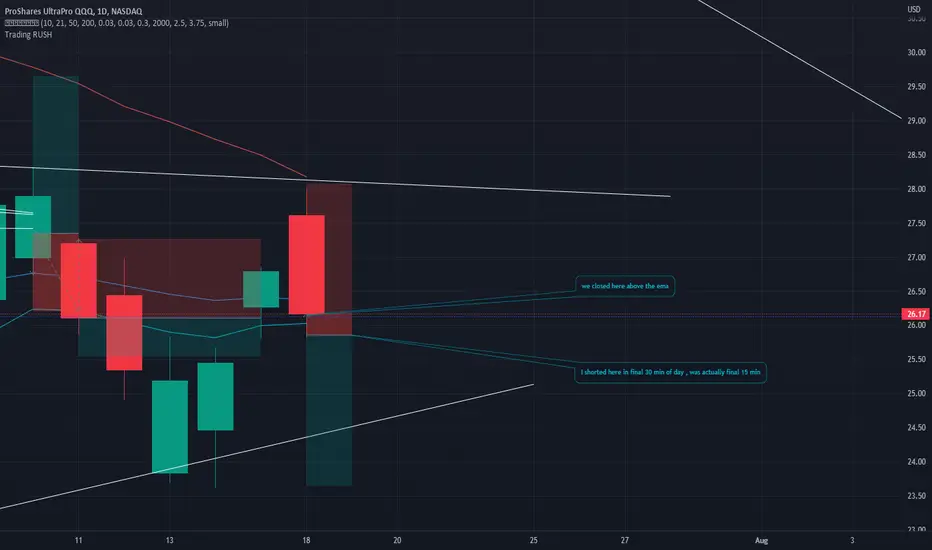
My precedence for getting short here at close on TQQQ was that QQQ closed under the 10 and 21 ema and it is in a stage 4 DT cycle.
It is basically my responsibility to take it the wedge drop signal even if I don't want to here . I waited until the end of day , final 30 min is my rule for entries ( filters false signals well ) . In this case I even waited until the final 15 min and saw the bearish engluphfing candle that was also a wedge drop , and put the trade on. But by the time we closed , we pushed up that tiny bit just above the lower ema and that's not a wedge drop. Then I had to make a decison as to what to do . I realized that this is somehow the first time to my recollection that has happened to me too and I did not yet have a rule on how to handle the event . I'm sure it will however happen again so I decided to just get out and to make it a standard protocol for when it happens in the future . If I take a wedge drop , or wedge pop trade and the signal fades in the final few minutes of trading day , Its no longer a signal really, so the only thing to do is get out at that point . I did stay in SPXL short though because it still checks the boxes ( SPY has put in a death cross and subsequent wedge drop that is also below the 50 sma)
Anyways long drawn out explanation but there's the logic and the update to my rules for the future.
false break or trend changethe reversal pattern is in if we close above the key levels marked out. we have tested this sentiment a few times in the past month, but each time its proven resistive. if that pattern turns green and we close in a bullish pattern breaking out of this wedge to the upside daily id imagine were in for the upper horizontals, and if we stay with sss and qqe in the red treating this area as resistive id imagine it gets shorted back down to the lower horizontals. bulls really want to hold that orange line (high volume area), and bears want to move below it.

Daniel GrecoNext Steps:
1. Identify patterns on the top 5 losers.
2. Identify long trades that get stopped out too early.
3. Identify long opportunities that we missed.

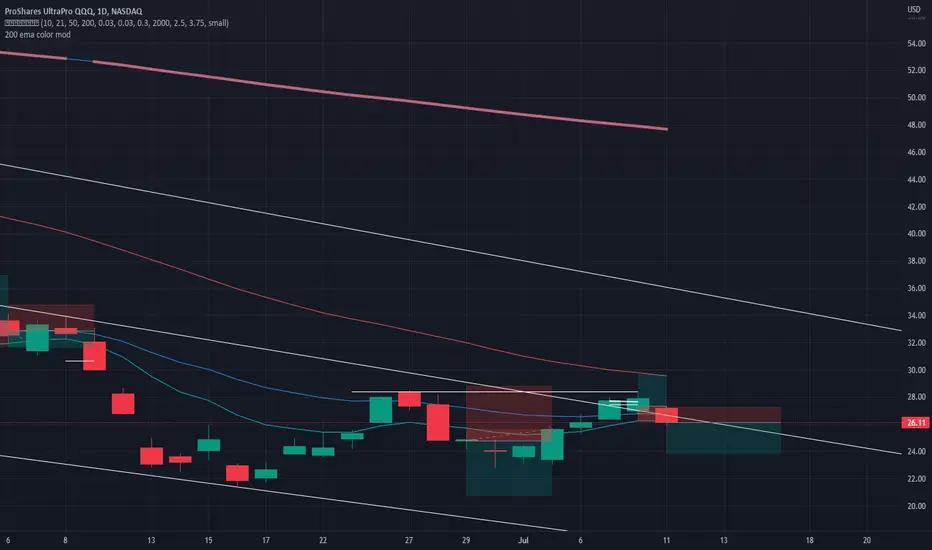
TQQQ, SHORT Stopped out on my TQQQ long today and we put in a wedge drop so even though I may not be super confident in the trade here with recent strength hints from the bulls , it's still a downtrading market, we did put in a higher low but not a higher high and still important for me to simply take the short signal .
Entry is right at todays close
25.93 in
Stop 27.27
PT 1 , 25.01 , sell 1/4 , stop to half risk
Pt 2 , 23.79 , sell 1/4 , stop same
run balance if possible ..
Personally , I kind of feel like we might be transitioning from a down trend to a range .. and that we might have put in a bottom on the 16th of June already ?? Now perhaps with todays failure by the bulls , some sideways chop seems likely .
found double bottom, no break out yetweve strongly supported a level twice but each time we were equally rejected as previous lows tested as resistance, slightly trending lower woth green days in red territory. themost likely scenario is if we retest recent highs as resistance, and make a lower high compared to a tightwning range over the past week or more. 25.82 is a lever to watch for a bull break targeting 26.25 - 25.05 is a level to watch for a bear break looking toward 24.54
sss and qqe are now singaling green

Revised Model Wednesday 7.13.22Normal Wednesdays are trending with a pump til 10, and then drop to a chop at 12:30. Even if price action is not a match on Wednesday, it is always a good idea to avoid the historical chop. I will grade and score the model at the end of the day Wednesday.
Tomorrow should be very interesting with CPI data being published. Happy Trading!

Thursday Model 7.14.22Thursday's model.
I won't be lectured by someone who has no quantitative background in forecasting, or ridicules the forecasting methodologies of the top Forbes 500 companies I have consulted. Models are tested daily. The history is the baseline to feed the model and project going forward. I don't have the time or energy to backtest each model I build and manually account for with special events--something a Pine Script can never do. If you want to build something better, then do it.
Regards

Revised Tuesday Model for 7.12.22This model excludes Tuesday data from 7.5 as it preceded FOMC minute publication and occurred after a 3 day holiday weekend.
Look to take advantage of early morning market, with possible pump followed by a drop. Try to exit before 11:15 where historical chops occur. Best to re-enter market after 2:45.
Patterns are lagging. The pattern can hold true whether the market closes up or down.

TQQQ , LONG ( early starter ) Although a slightly weaker open we still are above the 10/21 ema's and I am rooting for the bulls to keep price above them .
Will try to de risk this completely while keeping half the shares by the time and " if " we can get to the 50 sma where . That way if we close above the 50 , I'll still hold half these shares , which will be de-risked , and I can add another buy on a close above the 50.
Stop 26.15
PT 1 - 28.49 sell 1/4 and raise stop to half risk
PT 2 - 29.79 , sell another 1/4
run balance , just because clause and or a wedge drop exit

Monday model for 7.11Model is marked with swing points. I have also added a VWAP model with 4 standard deviation bands versus the price action. Notes on the model show how price returns to neutral throughout the day.
Note that we have had two Monday holidays recently - Juneteenth and July 4th holiday. So the most recent data we have for this pattern is 6/27. Be wary on Monday, as the lack of recent data could mean a significant shift in pattern could be taking place and the model is behind.
Models are built from exported Trading View data and built in Excel. These are intra-day patterns only and do not predict price action.
Happy Trading!

TQQQ how could anyone resist If you believe in the future of the market, if your in the market and staying in, then wouldn't it be very smart to get the tqqq at these prices right now considering how close we are around a bottom. Just from how low it is off from where it was, which is where the market was according to the QQQ ETF is an incredibly good deal and discount. If you believe in the future of the market then that clearly means this, the QQQ will recover, and thus the TQQQ will recover along side at 3x the Leveraged rate. I have been accumulating shares every time its red. I'm down but it does not matter since my price target is back at Novemeber 2021 levels. The same goes for UPRO and UDOW. And is say FNGU and SOXL and NAIL. Their sectors are to significant to not eventually recover.

TQQQ: Looking like a no-brainer buy, or is that the trap?NASDAQ:TQQQ Chart should show well enough what I'm conveying here. Either it rebounds from here, along with crypto and all the other indeces across markets, or we see lower lows, that reaches back into the March 2020 fear levels.

Model for Friday 7.8.12Historically, Fridays are a ranging market. This pattern is very different from the Holiday Weekend Friday pattern we had on July 1st - that is stored as a special holiday pattern. I look for tomorrow to resume a RANGED structure. Looks like there could be a big move in the morning (either up or down) and then reversal with somewhat flat movement into the close. Look for RANGE strategies to succeed.
This model excludes July 1st data, as that was a holiday weekend. That pattern is separate.

either/or nasdaq breakout or bullltrapif we break out in tqqq above the 28.50 level, id be long targeting the 32.33 area. if we break down below 24.10 however id look to short it down to around 20.11. nothing fancy here but you can see we are on the verge of breaking out in the nasdaq, and if we fail this resistance area it will probably take us much lower.

Revised Thursday Model for 7.7.22I have posted last week's original model, and the actual data from 6.30 that was averaged into the model for Thursday 7.7. Look for a rise until 11:50 AM with a drop until 12:15, followed by a gradual slow rise to end of day.
No time tonight to draw pretty lines for you all. Hope this helps everyone. Again--patterns shift over time, so always follow price action.

WED FOMC Pattern 7.6 Post-Mortem AnalysisI have updated the FOMC Minutes Model with today's actual data, and posted the charts for comparison. When looking at the actual data from today, you can see that the overall pattern held up quite well. It's not a perfect match, but it was never intended to be. We are looking for overall patterns and swing points. The pattern actually informed some key swing moments, including the 1150 AM drop, a slow rise in price towards minutes publication, the post publication rise, and then drop.
