Testing new heights - TQQQ Going to Drop from this ResistanceBased on very simple technical analysis on the weekly chart, it's looking like TQQQ is about to ricochet off the top and likely end up crashing due to decreased trading volumes in the NASDAQ. Without the volume to artificially prop up the stock prices underlying the TQQQ ETF, I'm predicting a stunning downside movement. History shows us that when this topline resistance is hit, things go down. At the minimum, I'm predicting a 15% downside movement. If this week's economic data continues to point negative, I think it'll lock into a downward cycle. This is not trading advice, but merely an observation and prediction. Shortby InvestingIsAScienceUpdated 2
Bearish Pattern coming in 9/20/19*** Disclaimer - This is my first published prediction. I've only been studying charts for about 4 months, so I wouldn't put much weight to this. Oh, this is not trading advice. Do not use this as a strategy. *** With the political climate coupled to sound recession indicators alarming and a correction to the job growth data for the year, I think a Head and Shoulders pattern was just formed. The accuracy of a head and shoulder's pattern in predicting a bullish to bearish reversal is *supposedly* quite accurate. With the trading for the week closed out for the day, this loss would be a confirmation of a reversal for the right shoulder (also making it an evening star pattern). I can foresee variability in the pattern due to artificial stimuli (tweets) boosting the market if occurring in tandem in the latter part of next week. Hope no one loses their revenue streams at a time when working for a living is no longer an option. Best wishes. M Shortby InvestingIsAScienceUpdated 3
Just Keep Swinging$TQQQ is in an obvious swing pattern. Good for buying and selling options in high volume. Highly predictable until it eventually breaks out of this pattern; but for now, make some money on it. Longby Possum682
TQQQ 15m chart double bottom and upside divergence on MACDTQQQ 15m chart double bottom and upside divergence on MACD. Quick trade I usually trade higher timeframes. Bought the AUg 9, 63 calls for 1.40Longby AIQ_SystemsUpdated 2
Daily TQQQ stock price trend forecast analysis19-JUL Investing position: In Rising section of high profit & low risk so far. But it would be in falling section tomorrow S&D strength Trend: In the midst of an adjustment trend of downward direction box pattern price flow marked by limited rises and downward fluctuations. Today's S&D strength Flow: Supply-Demand strength has changed from a weak selling flow to a strengthening selling flow again. read more: www.pretiming.com Forecast D+1 Candlestick Color : RED Candlestick %D+1 Range forecast: 1.1% (HIGH) ~ -1.5% (LOW), -0.2% (CLOSE) %AVG in case of rising: 2.8% (HIGH) ~ -0.8% (LOW), 2.1% (CLOSE) %AVG in case of falling:by pretiming4
wedge breakpossible nice breakdown in the Q's coming up. careful with earnings coming upby The_dumpster_diver2
Daily TQQQ stock price trend forecasts analysis.12-JUL NASDAQ:TQQQ Investing position: In Rising section of high profit & low risk S&D strength Trend: In the midst of an upward trend of strong upward momentum price flow marked by the temporary falls and strong rises. Today's S&D strength Flow: Supply-Demand(S&D) strength flow appropriate to the current trend. read more: www.pretiming.com Forecast D+1 Candlestick Color : GREEN Candlestick %D+1 Range forecast: 4.4% (HIGH) ~ 1.3% (LOW), 3.2% (CLOSE) %AVG in case of rising: 2.7% (HIGH) ~ -0.7% (LOW), 2.0% (CLOSE) %AVG in case of falling: 0.8% (HIGH) ~ -2.8% (LOW), -1.3% (CLOSE) Longby pretiming2
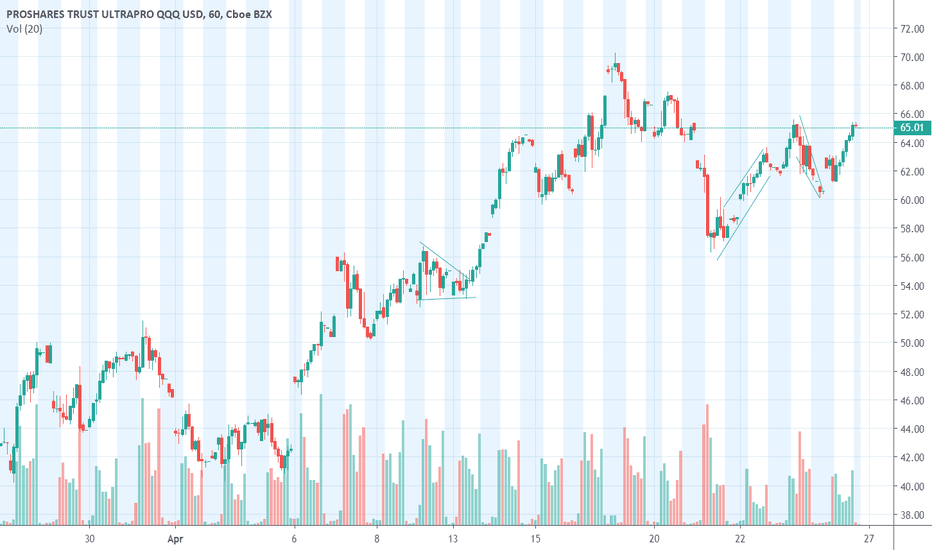
volume confirming the flagflag on the play. volume confirming. powell did a decent job very interesting mentionings on policy aheadLongby The_dumpster_diver0
TQQQ Direction?Shorted TQQQ down from 60s into the 40s, has followed chart closely and is testing support at 47.5. Oversold on 1hr, 4hr, and Daily timeframes indicate a strong possibility for a bounce. I don't recommend trading within the 42-47 price range as action in that range will likely be determined by algorithms and new headlines. If 42 support is broken potential short opportunity to 33by tsep24
PpSigna CFB and ATR BandBUY SIGNAL 1) When two cfb show buy signal. 2) When the price breaks out upper accelerator band . 3) The break out should be have buy volume. the system have buy and sell alarm.Educationby PpSignal016
Decision TimeWent long TQQQ in 46's a few days ago (same time as TWOU long position, I didn't publish the TQQQ long... and apparently the TWOU long position, sorry). Now TQQQ has hit a decision point. Previous resistance at $49.50 range. Double top, can either: 1) Break through resistance and go higher 2) Small sell off back to $46's. I don't see any catalysts RIGHT NOW for the market to head lower (except for a rapid drop in oil price). However, if Apple warns again, look out below. I'm keeping a close eye on this for now (for direction). But for now the trend is your friend (higher), which is also the path of least resistance. I may take some off the table here, let's see. Longby DennyPUpdated 1
TQQQ possible bear scenarioIf market does decide to follow valuations and not go to moon then I think this could be a possible scenario. Not financial advice.by mattgetsbarreled3
TQQQ longThe trend is your friend here. It does look like January will be a good month after all. MACD finally > 0, so new uptrend established. I figure the NASDAQ probably has a good 5% more before the end of January. Let's ride this trend for some upswing. TQQQ in at 44.70. Target = $49 (if NASDAQ 100 goes up 3%). Longby DennyPUpdated 0