TQQQ trade ideas
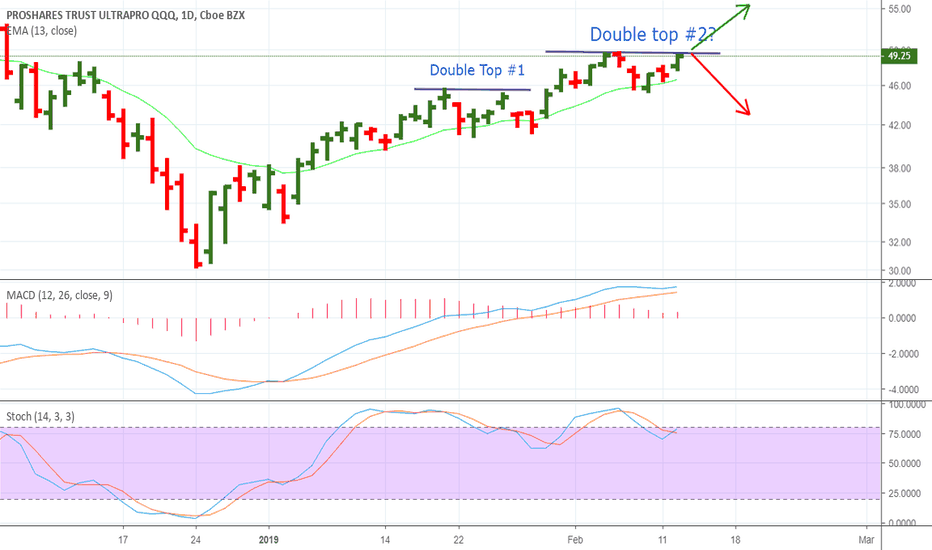
Decision TimeWent long TQQQ in 46's a few days ago (same time as TWOU long position, I didn't publish the TQQQ long... and apparently the TWOU long position, sorry). Now TQQQ has hit a decision point. Previous resistance at $49.50 range. Double top, can either:
1) Break through resistance and go higher
2) Small sell off back to $46's.
I don't see any catalysts RIGHT NOW for the market to head lower (except for a rapid drop in oil price). However, if Apple warns again, look out below.
I'm keeping a close eye on this for now (for direction). But for now the trend is your friend (higher), which is also the path of least resistance. I may take some off the table here, let's see.
TQQQ longThe trend is your friend here.
It does look like January will be a good month after all. MACD finally > 0, so new uptrend established. I figure the NASDAQ probably has a good 5% more before the end of January. Let's ride this trend for some upswing.
TQQQ in at 44.70. Target = $49 (if NASDAQ 100 goes up 3%).
Long position then Short PositionI don't think this rally based on the jobs report, Powell recognizing that market fluctuations will play an important role in the economy and thus the fed's decisions, and China agreeing to resume negotiations with Trump on trade has enough fuel to push the market through this cloud. The fear is so strong at this point. Investors are selling every rally. First line of resistance is the bottom trend line since the price broke through the channel to the downside. The second line of resistance is the top trendline. If the price breaks up through the first line of resistance, and perhaps some other fundamental factors come into play for the bulls, There might be a chance the price goes to $42-47. So IF and only IF the price sustains above the first resistance level, go long here at $38. I doubt the bulls will sustain the price above the top trendline, so I recommend a short position at around $42. The bottom of the next dip will be a doozy. Could see 50% profits on that short position.
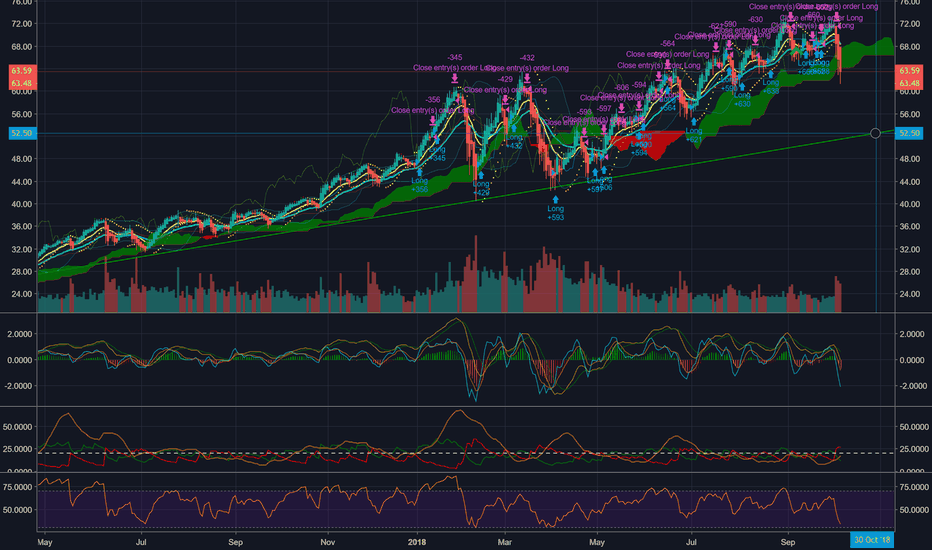
TQQQ hit my target low. Now I think we are going up.Those of you who saw my chart before perhaps bought TQQQ at $52.50, my target buy price, which should mean you are sitting very pretty right about now even through this short term market indecision. The bounce from this morning obviously didn't last, but the fast that corporate earnings are putting some positive pressure onto the market is a very good thing. I think we are headed much higher in the short term, especially considering Brexit deal coming to a close and concern over the U.S. China trade war is relaxing. I think the support level of 52.50 is fairly strong.
I see a short term bounce here.This maybe the start of wave 5. I see some bullish divergence on the MACD chart, which I first noticed yesterday. I think I mentioned it in a previous post. The price is going down, but MACD is going up. This is typically following by a sharp upward price movement which we saw today. The late day rally confirmed in my mind that others also view the recent dip as a bit overdone. We have earnings season kicking off today and JP Morgan posted good results, so FANG should have a bounce before there is any real threat of a recession. Now, if the Fed starts lowering interest rates, then maybe people should worry. But the economy is strong and profits should continue to fuel growth in the U.S.
TQQQ still has room to drop.MACD Line just turned negative one the 1D chart, which it hasn't done since March. Bond prices are soaring out of nowhere as the fed continues to raise rates. Yes, the economy is booming, but I think we are seeing the autumn slump here. Buying these loftily-priced FAANG stocks does not have a good R/R ratio. There will be a great buy opportunity coming soon. This is just the kind of volatility boost the market needed in order to move forward in a positive direction.


