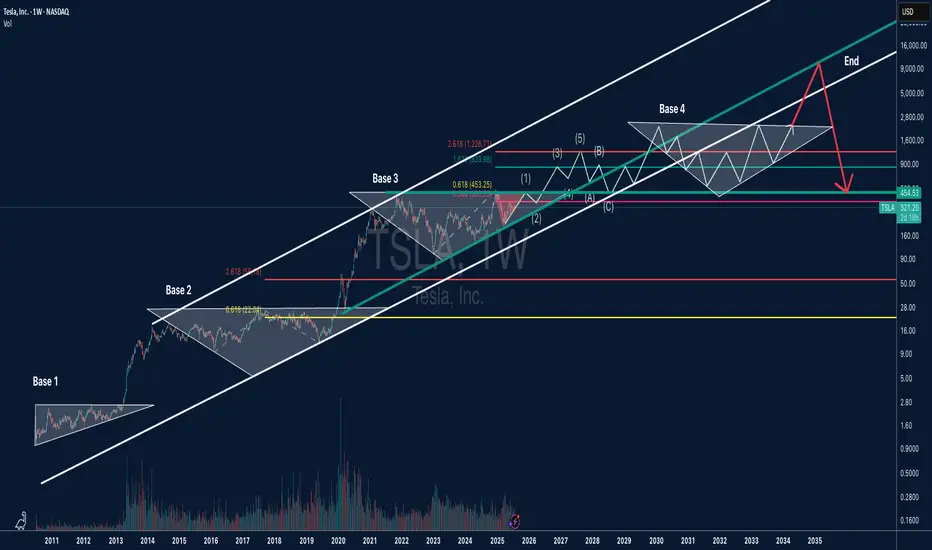
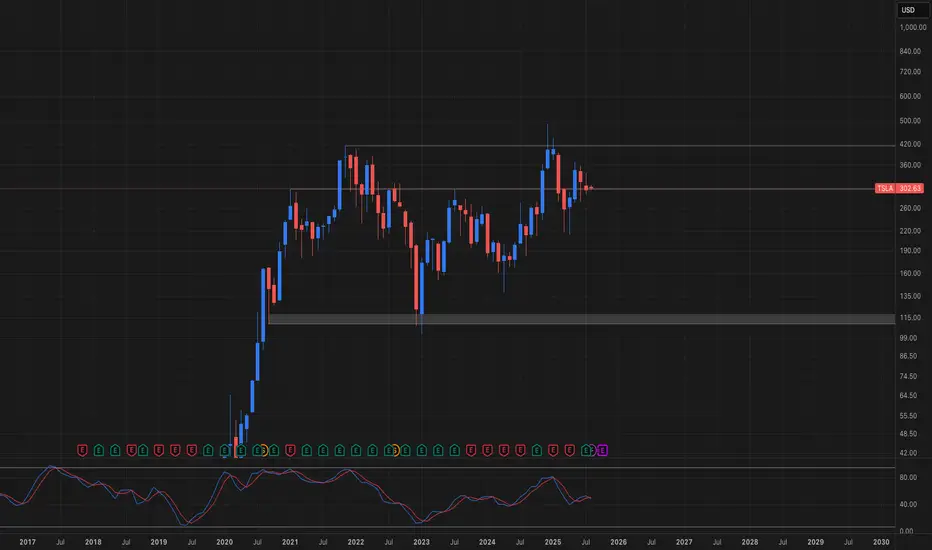
TSLA Long-Term Bold Projection (2025-2035)This is a long-term analysis of Tesla (TSLA) stock on the weekly timeframe, combining Elliott Wave Theory, Fibonacci extensions, and price structure (base formations) within a broad logarithmic trend channel.
Key Highlights:
🔹 Base Formations:
Base 1 (2010–2013): First consolidation before TSLA’s breakout.
Base 2 (2014–2019): A wide triangle structure leading to explosive growth.
Base 3 (2021–2024): Ongoing range suggesting wave (2) correction.
Base 4 (2026–2032): Projected future range before a possible euphoric blow-off phase.
🔹 Elliott Wave Structure:
Current wave count suggests TSLA is finishing wave (2) of a larger 5-wave structure.
Bullish impulse expected with wave (3), (4), and (5) leading to new ATHs, potentially into the $8,000–$10,000+ range.
A corrective ABC phase may follow, bringing price back toward key support (~$450 zone), aligned with Fibonacci retracements and channel support.
🔹 Fibonacci Levels:
0.618 and 2.618 extensions align with historical breakout points and future resistance zones.
Long-term projection targets include $1,226, $4,400, and potentially $8,000+, with eventual reversion to the mean.
🔹 Log Channel:
Price has respected a long-term ascending channel.
Midline and upper resistance bands guide potential future resistance zones.
TSLA trade ideas
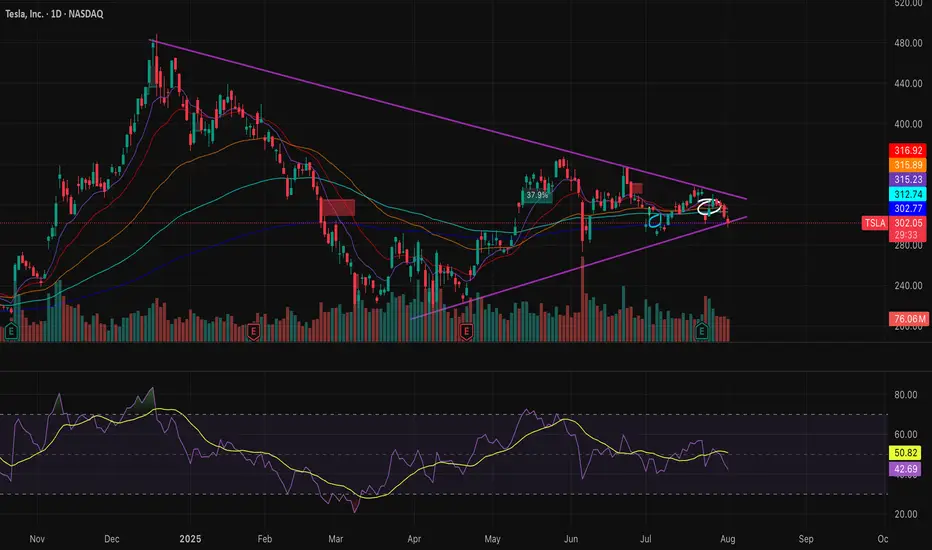
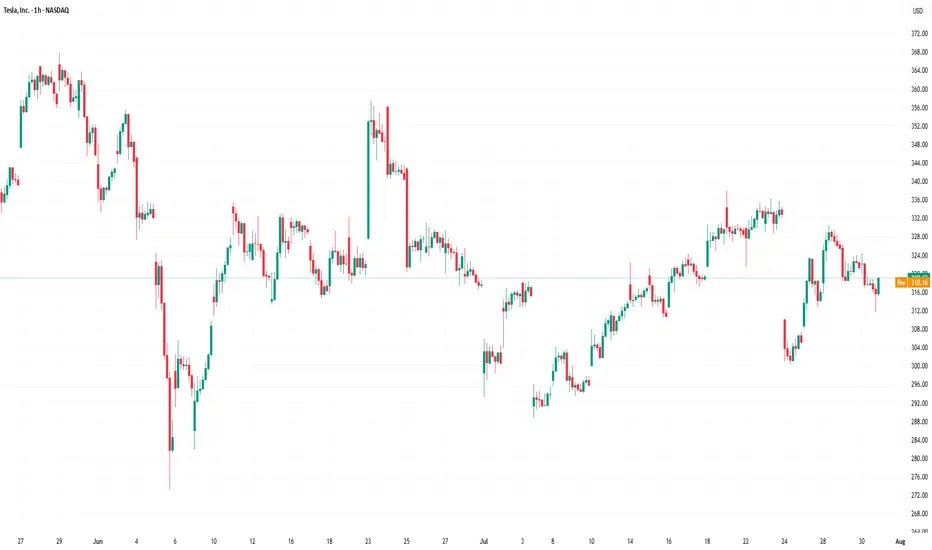
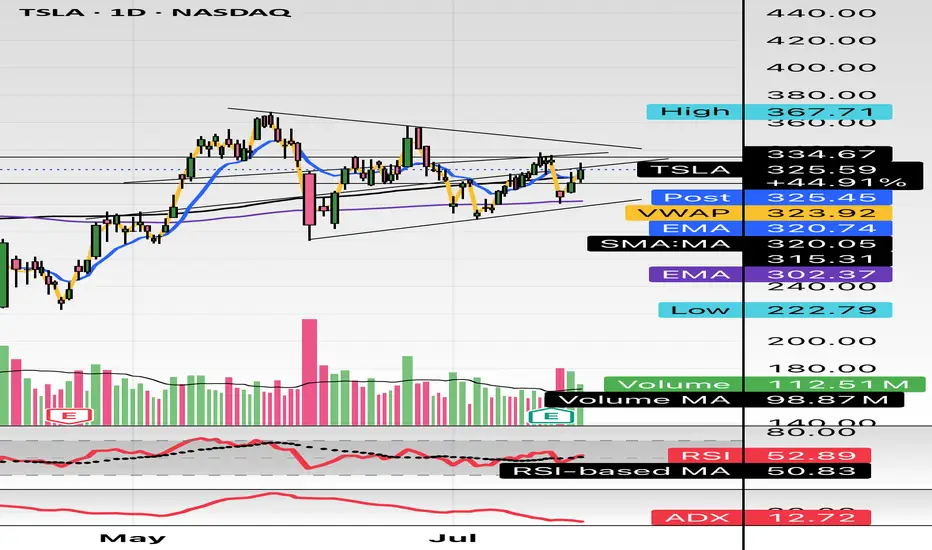
Tesla Builds Momentum - Can It Reach $490?Tesla Builds Momentum - Can It Reach $490?
From a technical perspective, Tesla is showing signs of volume accumulation and appears to be forming a contracted triangle pattern.
The price seems to have found solid support around 287, suggesting this corrective phase might be nearing its end.
If the price breaks out of the triangle, especially above 330, the dominant bullish trend is likely to resume.
On top of that, Tesla’s quarterly results beat expectations, which further strengthens the bullish outlook.
My eyes are on price targets around 400, 450, and 490.
News:
📊 Tesla approves share award worth $29 billion to CEO Elon Musk
Tesla has granted CEO Elon Musk 96 million shares worth about $29 billion, a move aimed at keeping the billionaire entrepreneur at the helm as he fights a court ruling that voided his original pay deal for being unfair to shareholders.
📊Tesla signed on Wednesday a $4.3 billion battery deal with LGES, source says, reducing China reliance. South Korea's LG Energy Solution has signed a $4.3 billion deal to supply Tesla with energy storage system batteries, said a person familiar with the matter, as the U.S. company looks to reduce reliance on Chinese imports due to tariffs.
You may find more details in the chart!
Thank you and Good Luck!
PS: Please support with a like or comment if you find this analysis useful for your trading day

TSLA: Watching for short. I think there might be sell off, looking at the chart. I could be wrong so ll observe for now. I will go in if the momentum towards downward accelerate.
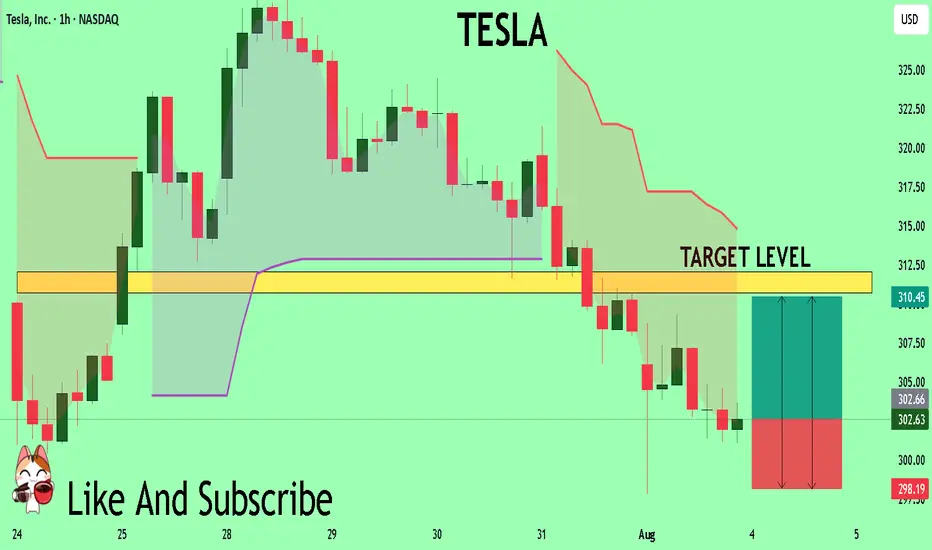
TESLA Sellers In Panic! BUY!
My dear friends,
TESLA looks like it will make a good move, and here are the details:
The market is trading on 302.63 pivot level.
Bias - Bullish
Technical Indicators: Supper Trend generates a clear long signal while Pivot Point HL is currently determining the overall Bullish trend of the market.
Goal - 310.73
Recommended Stop Loss - 298.19
About Used Indicators:
Pivot points are a great way to identify areas of support and resistance, but they work best when combined with other kinds of technical analysis
Disclosure: I am part of Trade Nation's Influencer program and receive a monthly fee for using their TradingView charts in my analysis.
———————————
WISH YOU ALL LUCK
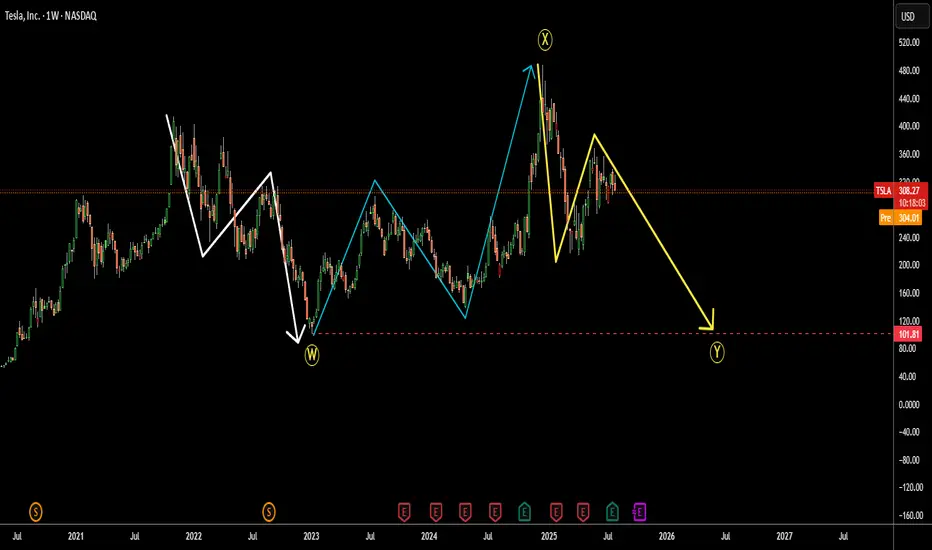
Tesla (TSLA) Crash Ahead? $101.81 Retest in SightThe Tesla price chart appears to show a large flat correction labeled W-X-Y.
Wave W consists of three downward waves from 2021 to 2023. (white)
Wave X shows a three-wave upward retracement from 2023 to 2024, which even overshot the start of wave W. (blue)
Now, we seem to be in the final leg of the third move: wave Y down. (yellow)
Typically, wave Y retests the bottom of wave W.
If that holds, we could see Tesla’s price revisit the 2023 low of $101.81.
Is Tesla losing its appeal?
I’d love to hear your thoughts.
Tesla - The all time high breakout!🚗Tesla ( NASDAQ:TSLA ) will break out soon:
🔎Analysis summary:
For the past five years Tesla has overall been consolidating between support and resistance. But following the recent bullish break and retest, bulls are slowly taking over control. It is actually quite likely that Tesla will soon break above the previous all time highs.
📝Levels to watch:
$400
🙏🏻#LONGTERMVISION
SwingTraderPhil

Make or Break point for TSLAlots of bulls and bears for TSLA. Wedging for a bit now. Filled the 296 gap and gap above, now its time to see if TSLA wants up or down. RSI MACD stabilized, volume thinned out, so whatever direction it chooses I think will be explosive. Plenty of Call and Put flow on both sides.
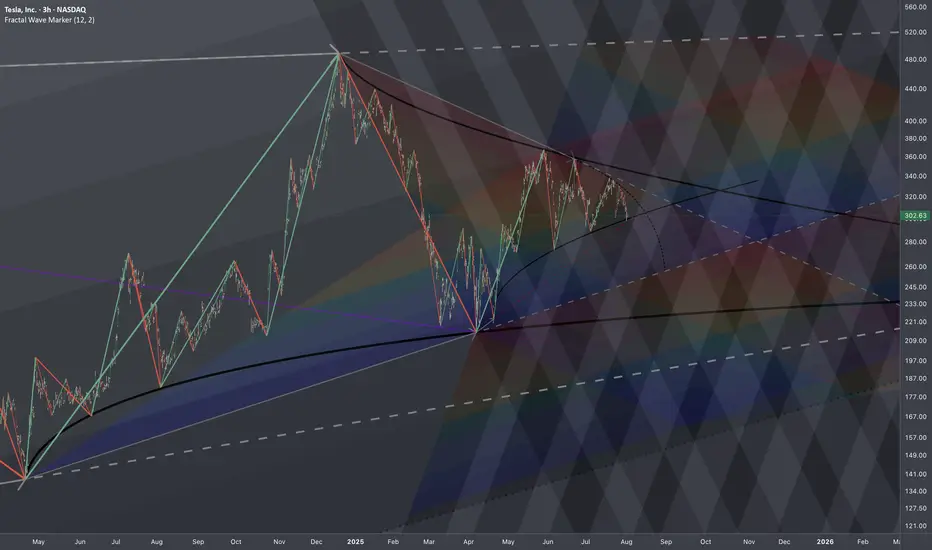
$TSLA: Branching Effect🏛️ Research Notes
Reaching branching effect through cross-cycle interconnection. Alongside I'll test some elements mentioned below.
Local Progressions
Rhyme and levels derived from apparent cycle compression.
Added channels with darkening gradient that cover bullrun from mid 2019, driven by angle of tops.
In the local scope, as price deepens into denser zone the probability of disproportional reaction gets higher. t would probably complete its intermediate and even longer-term cycles before escaping the boundary.
$TSLA 3rd Time's a CharmI bottom called NASDAQ:TSLA twice in a row. About to do it a third time today. 312.5C 8/8 @ 4.47 were just bought for $1.3 million.
TSLA Breakout Watch: Symmetrical Triangle Squeeze!Trade Summary
Setup: Symmetrical triangle pattern tightening since March; volatility compression signals an imminent breakout.
Entry: On daily close above the triangle resistance (~$324)
Stop‑loss: Below triangle support (~$305)
Targets:
• Target 1: $375
• Long-term: $500+
Risk/Reward: ~2.5–3:1 (Initial target), higher for long-term hold
Technical Rationale
📈 Symmetrical triangle: Clear converging trendlines; price nearing apex after months of higher lows and lower highs
🔔 Volatility squeeze: Range compression increases odds of explosive move
⏳ Daily timeframe: Signals a swing/position trade opportunity with significant upside
Catalysts & Context
⚡️ Earnings season ahead could trigger a breakout
🌱 EV sector momentum and renewed tech leadership
🏦 Analyst upgrades and potential for macro rate cuts
Trade Management Plan
Entry: Wait for a daily close and volume confirmation above $324 resistance
Stop-loss: Tight initial stop below $305; trail to breakeven after breakout confirmation
Scaling: Partial profits at $375; let remainder run for $500+ if momentum continues
Poll
What’s your view? Are you watching TSLA? Comment below or vote:
🔼 Bullish
🔽 Bearish
🔄 Waiting for confirmation
Follow us for daily high-probability setups & real-time trade updates!
Disclaimer: Not financial advice. Trade at your own risk.

TSLA: Here is what I see in TSLA"Zoom In. Follow the Sequence."
Just analyzing sequential wave patterns across multiple timeframes.
You can zoom in and see how structure evolves — impulse, correction, then continuation.
Maybe there’s a strategy here that repeats. Maybe not.
But if there is... it’s worth finding.

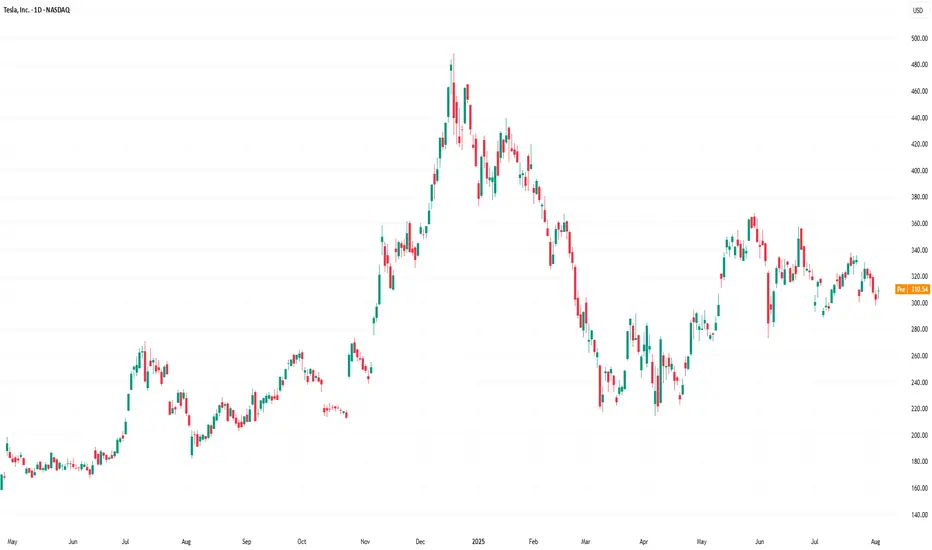
Tesla Stock in Bearish Trend - Further Downside ExpectedTesla Stock in Bearish Trend - Further Downside Expected
Tesla's (TSLA) stock price continues to display a clear bearish trend structure, characterized by the formation of consistent lower lows and lower highs on the price chart. This technical pattern suggests sustained selling pressure and indicates the downtrend will likely persist in upcoming trading sessions.
Key Technical Observations:
- Established Downtrend: The consecutive lower highs and lows confirm the bearish price structure remains intact
- Weak Momentum: Each rally attempt has failed to gain traction, meeting selling pressure at progressively lower levels
- Critical Price Levels: The stock has established well-defined resistance and support zones for traders to monitor
Price Projections:
- Downside Target at $272: The bearish momentum could drive TSLA toward the $272 support level, representing a potential 15% decline from current levels
- Key Resistance at $370: Any recovery attempts will likely face strong selling pressure near the $370 level, which now serves as a major resistance barrier
Market Implications:
1. Bearish Continuation Expected: The prevailing trend structure favors further downside unless a significant reversal pattern emerges
2. Breakdown Risk: A decisive move below current support levels could accelerate selling momentum toward $272
3. Short-Term Rally Potential: While the overall trend remains down, temporary rebounds toward $370 may present selling opportunities
Trading Considerations:
- Short Positions: Consider maintaining bearish exposure while price remains below the $370 resistance level
- Stop Loss: A sustained break above $370 would invalidate the immediate bearish outlook
- Profit Targets: $272 serves as the primary downside objective, with potential support levels to watch along the way
Risk Factors to Monitor:
- Market sentiment shifts in the EV sector
- Changes in Tesla's production/delivery outlook
- Broader market conditions affecting tech/growth stocks
The technical setup suggests Tesla shares remain vulnerable to further declines, with $272 emerging as the next significant downside target. Traders should watch for either confirmation of the bearish continuation or potential reversal signals near key support levels. As always, proper risk management remains essential when trading in trending markets.

UPTADE TESLA -- 250 USD still potentialTesla is consolidating in a tight range, showing bearish pressure near the lower boundary of the formation. Moving averages (MA 5/10/30/60) are flattening, indicating a loss of bullish momentum, while the Wavetrend oscillator has issued a sell signal (bearish crossover below the zero line). A downside breakout from this range projects a potential move toward the $250 level, as illustrated by the measured move. This bearish scenario gains validity if price breaks below the $315 support level.
Potential TP still 250 USD

Don’t Be Surprised to See $TSLA at $100/Share Down the LineTesla ( NASDAQ:TSLA ) has spent the last 5 years ranging between $100 and $300, with only two spikes — November 2021 and December 2024 — both of which failed to hold above $400. Structurally, this is a long-term range stock at this point.
Unless we see breakout with volume above the $400 level, the odds still favor a continued range. Long-term investors and traders should remain open to the idea of a retest toward the bottom of the channel ($100) — especially if Tesla's financials’s face pressure.
TSLA LONGQuite a simple set up. Confirmation is still needed on 3d, and daily. Bullish candles and volume is desperately needed for validation of symmetrical setup.
Volatility incoming. Break of ATH with strength leads to price discovery into $500+.

Fibonacci Arcs in Stock TradingFibonacci Arcs in Stock Trading
Fibonacci arcs, derived from the renowned Fibonacci sequence, offer a compelling blend of technical analysis and market psychology for traders. By mapping potential support and resistance areas through arcs drawn on stock charts, these tools provide insights into future price movements. This article delves into the practical applications of Fibonacci arcs in trading, their interplay with market psychology, and best practices for effective use.
Understanding Fibonacci Arcs
The Fibonacci arc indicator is a unique tool in technical analysis derived from the famed Fibonacci sequence. It’s crafted by drawing arcs at the key Fibonacci retracement levels - 38.2%, 50%, and 61.8% - from a high to a low point on a stock chart. Each curve represents potential support or resistance areas, offering insights into the stock’s future movements.
The art of arc reading, meaning interpreting these curves, is crucial for traders. When a stock approaches or intersects with an arc, it reflects a significant reaction level. For instance, if a stock price touches or nears an arc, it could face arc resistance, indicating a potential halt or reversal in its trend.
Applying Fibonacci Arcs in Trading
In the stock market, these arcs serve as a guide for traders seeking to anticipate future price movements. When applied correctly, they can provide critical insights into potential support and resistance levels. Here's a step-by-step look at how you may use them effectively:
- Identifying High and Low Points: Begin by selecting a significant high and low point on the stock's chart. In an uptrend, it’s the most recent swing high to a previous swing low, and vice versa. These are the anchor points.
- Drawing the Arcs: Once the points are selected, draw the arcs at the Fibonacci retracement levels of 38.2%, 50%, and 61.8%. They radiate from the chosen low point to the high point (or vice versa), cutting across the chart.
- Interpretation: Watch how the stock interacts with these lines. When the price approaches an arc, it might encounter resistance or support, signalling a potential change in trend or continuation.
- Timing Entries and Exits: Traders can use the arcs in the stock market as a tool to time their trading decisions. For instance, a bounce could be a signal to enter a trade, whereas the price breaking through might suggest it's time to exit.
Fibonacci Arcs and Market Psychology
The effectiveness of Fibonacci arcs in trading is deeply intertwined with market psychology. They tap into the collective mindset of traders, who often react predictably to certain price levels. The Fibonacci sequence, underlying this tool, is not just a mathematical concept but also a representation of natural patterns and human behaviour.
When a stock nears a curve, traders anticipate a reaction, often leading to a self-fulfilling prophecy. If many traders make an arc stock forecast, they might sell as the price approaches a certain point, causing the anticipated resistance to materialise. Similarly, seeing support at an arc can trigger buying, reinforcing the tool’s power.
This psychological aspect makes Fibonacci arcs more than just technical tools. They are reflections of the collective expectations and actions of market participants, turning abstract mathematical concepts into practical indicators of market sentiment and potential movements.
Best Practices
Incorporating Fibonacci arcs into trading strategies involves nuanced techniques for better accuracy and efficacy. Here are some best practices typically followed:
- Complementary Tools: Traders often pair this tool with other indicators like moving averages or RSI for a more robust analysis.
- Accurate Highs and Lows: It's best to carefully select the significant high and low points, as the effectiveness of the curves largely depends on these choices.
- Context Consideration: Understanding the broader market context is crucial. Traders usually use Fibonacci arcs in conjunction with fundamental factors to validate their analysis.
- Watch for Confluence: Identifying areas where Fibonacci levels converge with other technical signals can provide stronger trade setups.
- Practice Patience: Traders typically avoid making hasty decisions based solely on Fibonacci levels. It's usually better to wait to see additional confirmation from the price action.
Advantages and Limitations of Fibonacci Arcs
Fibonacci arcs are a popular tool in technical analysis, offering distinct advantages and some limitations in analysing stock movements. Understanding these can help traders leverage the tool more effectively.
Advantages
- Intuitive Nature: The Fibonacci sequence is a natural pattern, making the tool intuitive for traders to understand and apply.
- Dynamic Support and Resistance Levels: They provide dynamic levels of support and resistance, unlike static lines, adapting to changing market conditions.
- Versatility: Effective in various market conditions, the arcs can be used in both trending and sideways markets.
Limitations
- Subjectivity in Selection: The effectiveness largely depends on correctly identifying the significant high and low points, which can be subjective.
- Potential False Signals: Like all technical tools, they can generate false signals, especially in highly volatile markets.
- Requires Complementary Analysis: To maximise effectiveness, these curves are usually used alongside other technical indicators, as they are not infallible on their own.
The Bottom Line
Fibonacci arcs are invaluable tools in stock analysis, providing insights into market trends and potential price movements.
This article represents the opinion of the Companies operating under the FXOpen brand only. It is not to be construed as an offer, solicitation, or recommendation with respect to products and services provided by the Companies operating under the FXOpen brand, nor is it to be considered financial advice.
TSLA: short as short can...below 200 certainly worth considering a reentry, but currently not sure if it will stop at 200 of 150.

TeslaIn regard to Tesla, not a lot happened last week. Price started to raise back up towards the orange target box the week prior but failed to make new local highs. After that slight raise, it spent the last week grinding lower and breached the prior local low. If it can manage to breach the orange c wave low @ $288.77 (marked by red dashed line), we're headed to the grey target box.
That red dashed line is very significant. The reason being is it invalidates the potential triangle if it gets breached. Should that happen, the only pattern I see is pointing to the grey box. If we do head to the lower target box, the $220's looks like the sweet spot for minor A to complete. I say this due to the green 1.618, yellow 1.618, & white 0.618 fibs being in that area. As you know, all levels of .618 are some of the strongest fibs if not THE strongest.
Should orange prevail, and we have in fact carved out a triangle, the likely target would be the 0.786 @ $429.81 IMO. We have to wait to find out though as price is still refusing to lift its skirt and show the goods so to speak.
To repeat and summarize, below $288.77 and we're likely headed to the gray box. Above the orange (D) high @ $338.88 (orange dotted line), and we're most likely headed to the orange target box. If we can manage to get into the grey box, I will begin looking for an entry very likely in the $220's or $230's.

Cyclical Stocks vs Non-Cyclical Stocks: How Can You Trade Them?Cyclical Stocks vs Non-Cyclical Stocks: How Can You Trade Them?
Not every stock is created equal. One of the biggest distinctions is cyclical vs non-cyclical—those that grow or decline alongside economic conditions and those that are less sensitive. In this article, we explore the key differences between the two, how to analyse both, and how to trade them.
What Are Cyclical Stocks?
Cyclical stocks are those that rise and fall in line with the broader economy. They’re more sensitive to consumer spending and include those in the travel, automotive, construction, and luxury goods sectors.
Simply put, when consumers have more disposable income, they’re likely to buy new cars, travel abroad, or invest in home improvements. Demand boosts corporate earnings and pushes share prices higher. However, when consumers have less money or face economic uncertainty, they reduce and delay spending on these discretionary purchases, dampening company earnings and stock valuations.
Nike and Starbucks are good examples here—both are cyclical companies that see higher demand when consumers are in a stronger financial position and feel comfortable purchasing brand-name clothes or buying coffee on the go.
Cyclical stocks tend to be more volatile than non-cyclical ones. Their sensitivity to cyclical business conditions offers potential opportunities for traders to capitalise on a growth phase, but timing matters—getting caught in a temporary or prolonged downturn can lead to sharp drawdowns.
Cyclical Sectors
- Automotive
- Airlines & Travel
- Luxury Goods & Apparel
- Construction & Materials
- Banking & Financial Services
- Technology & Semiconductors
- Restaurants & Entertainment
- Retail (Discretionary Spending)
Is Tesla a Cyclical Stock?
Yes, Tesla is a cyclical stock. Demand for electric vehicles moves in line with economic conditions, consumer spending, and interest rates.
Is Amazon a Cyclical Stock?
Amazon is partly cyclical. Its retail business depends on consumer spending but its cloud computing division (AWS) sees constant demand and provides diversification.
What Are Non-Cyclical Stocks?
Non-cyclical stocks belong to companies that sell essential goods and services. Contrasting with cyclical stocks and their sensitivity to consumer spending, non-cyclical companies sell things people buy regardless of economic conditions. They’re often referred to as defensive stocks because they tend to hold up when the economy weakens.
Non-cyclical sectors include healthcare, utilities, and consumer staples. Supermarkets, pharmaceutical companies, and electricity providers see relatively steady demand because people still need food, medicine, and power whether the economy is growing or contracting.
For example, consumer non-cyclical stocks, like Procter & Gamble, which owns brands like Oral-B, Charmin, and Gillette, continue to generate revenue year-round because consumers still buy everyday household items. The same goes for Johnson & Johnson, which sells medical products that hospitals and pharmacies need.
Compared to cyclical stocks, non-cyclical stocks are usually less volatile because their earnings are more consistent. While their potential returns are relatively limited vs their more growth-oriented cyclical counterparts, non-cyclical stocks are believed to not dive as sharply during a downturn.
Non-Cyclical Sectors
- Consumer Staples (Everyday Goods)
- Healthcare & Pharmaceuticals
- Utilities (Electricity, Water, Gas)
- Telecommunications
- Grocery & Essential Retail
- Defence & Aerospace
How Traders Analyse Cyclical Stocks
In a market where going long or short volatile cyclical stocks is an option (such as with CFDs), many prefer to trade them over non-cyclical stocks. More broadly, traders analyse a few key indicators to determine whether cyclical stocks are in a growth phase.
Macroeconomic Indicators
When GDP expands, businesses and consumers spend more, and free-flowing spending boosts demand in cyclical sectors. Similarly, interest rates determine spending on more big-ticket purchases, like cars, homes, and luxury goods. Lower interest rates encourage borrowing and vice versa.
Employment rates also play a key role. More layoffs and a higher unemployment rate mean consumers dial back purchases of discretionary goods and services. Employment conditions, along with economic and policy uncertainty, drive consumer confidence. When optimism is high, cyclical stocks often rally.
Earnings Trends & Sector Data
Unlike non-cyclical companies, cyclical firms see earnings fluctuate based on economic cycles. Traders pay attention to quarterly reports and especially forward guidance. If a company expects strong sales growth due to rising demand, this can drive its stock price higher and possibly signal an upswing in the sector.
Industry-specific data, like auto sales figures or airline bookings, is also a useful gauge for assessing the future performance of a company.
Market Sentiment & Seasonal Trends
Cyclical stocks are prone to seasonal patterns—retailers surge in the holiday season, while travel stocks perform well in summer. Market sentiment is another important factor; for instance, if economic uncertainty is growing but investors on the whole believe it to be a temporary blip, then cyclical stocks may still rise.
Analysing Non-Cyclical Stocks
While traders often favour cyclical stocks for their higher potential returns, many still turn to non-cyclical companies as a possible form of short-term defence against downturns, to balance a long-term portfolio, or when unique occasions arise (earnings reports, company-specific news, etc.).
Earnings Stability & Cash Flow
Since non-cyclical companies sell essential goods and services, their earnings tend to be more consistent. Traders look at revenue trends, gross margins, and free cash flow to assess a firm’s ability to generate relatively steady income. Consistent earnings—even during downturns—can be a marker of a strong non-cyclical stock.
Dividend History & Payout Ratios
Many non-cyclical stocks pay dividends. That makes them attractive for those looking for income-generating assets. A company with a long track record of consistent or growing dividend payments is often a sign of financial strength. The payout ratio (dividends paid as a percentage of earnings) is another metric traders examine—too high, and it could indicate unsustainable distributions.
Market Conditions & Defensive Rotation
If economic uncertainty rises, investors will generally shift into defensive sectors like healthcare, utilities, and consumer staples. Many will monitor fund flows—where institutional money managing exchange-traded funds (ETFs), mutual funds, and large portfolios is headed—to understand if risk aversion is growing.
Likewise, outperformance in certain sectors can be a signal. If sector indices like the S&P 500 Consumer Staples Index or the S&P 500 Healthcare Index outperform the overall S&P 500, it may indicate capital moving into non-cyclical stocks.
Trading Cyclical and Non-Cyclical Stocks
Now, let’s take a closer look at how traders engage with these stocks.
Short-Term Trading
Short-term traders generally focus on stocks or sectors expected to move over hours or days. One strategy might be to examine the broader conditions and trade ahead of earnings reports. If summer is approaching and the economy is doing well, Delta Air Lines could rise in the weeks before an earnings release as traders anticipate strong quarterly performance and positive forward guidance.
Another strategy is trading macro themes. If inflation rises, traders might focus on companies with strong pricing power, like consumer staples firms that can pass costs onto consumers. If economic data points to a slowdown, they might focus on healthcare stocks.
Medium-Term Trading
Medium-term traders take a broader view and typically adjust their portfolio weightings based on economic conditions. During expansions, they may overweight cyclicals like construction and travel stocks, while shifting into non-cyclicals as recession risks grow. That could mean just rebalancing a collection of ETFs, over/under-weighting a set of stocks, or a mix of both.
Here, the focus is usually on broader economic trends while also staying alert for possible strengthening or weakening consumer demand.
Long-Term Trading
Long-term traders often hold a mix of cyclical and non-cyclical stocks to maintain a balanced portfolio across economic cycles. While they may still adjust weightings over time, they tend to be more concerned with long-term sector trends and income generation.
With a longer time horizon, these traders may be more willing to allocate more capital to cyclical stocks during a downturn, especially to otherwise strong companies or sectors, to take advantage of potential rebounds months down the line.
The Bottom Line
Understanding the difference between cyclical and non-cyclical stocks is fundamental to trading them. Careful analysis—macroeconomic, sectoral, and company-specific—can help traders identify potential opportunities across all time horizons.
FAQ
What Are Examples of Cyclical Stocks?
Cyclical stocks include Tesla (TSLA), Delta Air Lines (DAL), Nike (NKE), Caterpillar (CAT), Marriott International (MAR), and Ford (F).
Which Industries Are Most Cyclical?
Highly cyclical industries include automotive, airlines, hospitality, construction, luxury goods, and consumer discretionary retail.
Is Coca-Cola a Cyclical Stock?
No, Coca-Cola is considered a non-cyclical stock. Demand for its wide range of products remains stable regardless of economic conditions.
Is Starbucks a Cyclical Stock?
Yes, Starbucks is a cyclical stock. Coffee purchases aren’t essential, so demand fluctuates based on disposable income and consumer confidence.
This article represents the opinion of the Companies operating under the FXOpen brand only. It is not to be construed as an offer, solicitation, or recommendation with respect to products and services provided by the Companies operating under the FXOpen brand, nor is it to be considered financial advice.
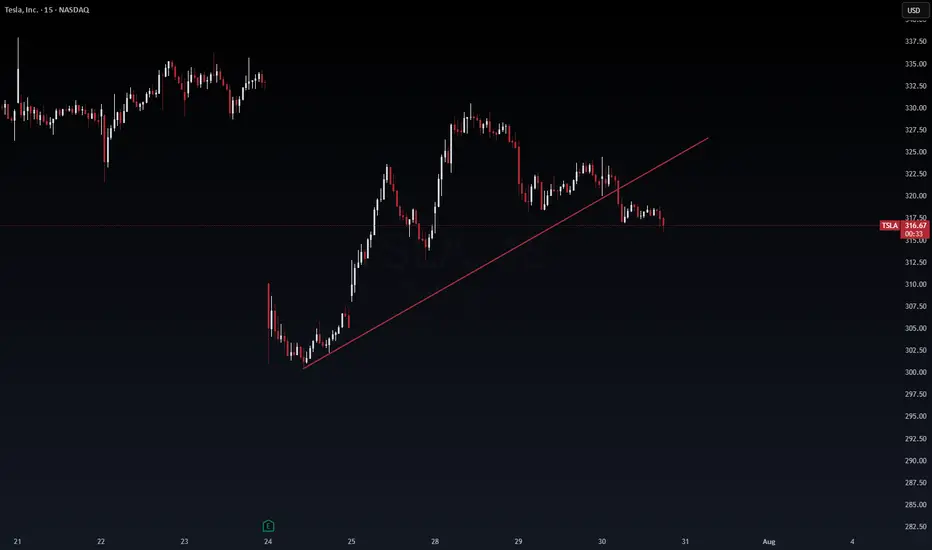
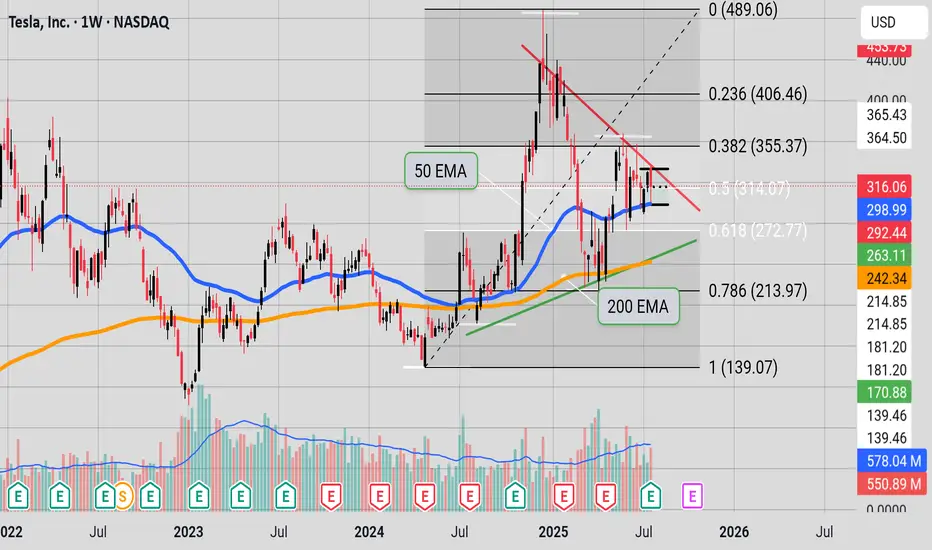
Inflection point"Tesla is at a binary point on the chart. The stock is wedged tightly between the red, downward-sloping resistance line (upper boundary) and the green, upward-sloping support line (lower boundary)—the classic apex of an asymmetrical triangle.
At this stage:
A breakout above the red resistance would be a clear bullish signal, potentially starting a new upward trend.
A rejection at resistance and breakdown below the green support would signal bearish momentum, with likely downside toward lower Fibonacci levels like 272.77 or 213.97.
With price at this inflection zone, the next decisive move—either up or down—will likely define Tesla’s short-to-medium-term trend. This is a textbook example of a binary technical situation: whichever direction is confirmed next, that’s likely to dictate the coming weeks' price action." (Some help from Perplexity)
TSLA Don't Miss Out
### 🔥 TradingView Viral Post Format 🔥
---
### 📢 **Title:**
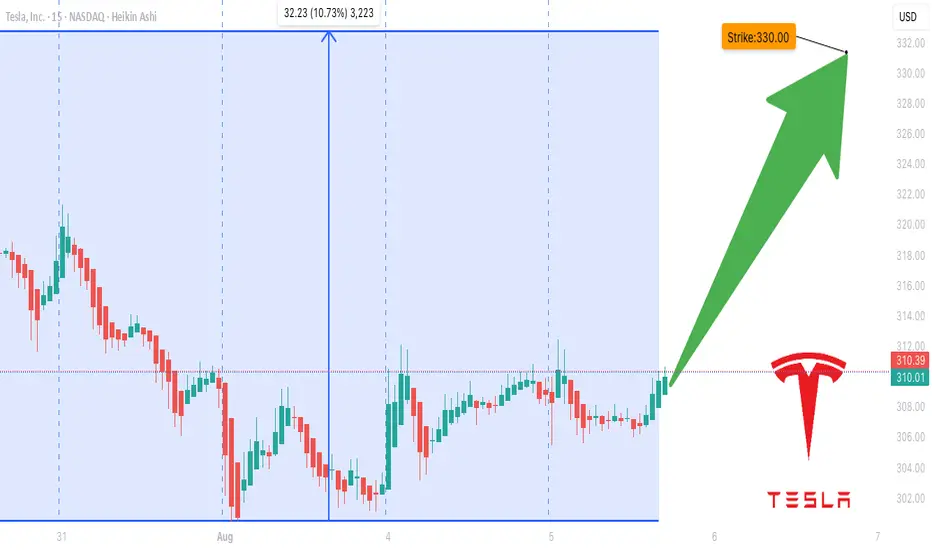
**TSLA Options Surge? \$330 Call Could Double in 3 Days — Here's the Setup** 🚀📈
---
### 📝 **Description:**
Tesla’s options market is flashing **moderate bullish signals** this week! 📊
✔️ Call/Put Ratio: **1.39** (Bullish)
✔️ RSI (Daily & Weekly): **Rising**
⚠️ Volume is light, but sentiment leans bullish.
🎯 **Trade Idea:**
Buy TSLA \$330 Call (Exp: Aug 8)
💰 Entry: \$0.85
🎯 Target: \$1.70
🛑 Stop: \$0.43
⏱️ Confidence: 65%
⚡ Gamma risk rising with time decay — tight execution is key.
Is this the breakout or a bull trap? Let’s watch it play out 👀
👇 Drop your thoughts or setups in the comments!
---
### 🏷️ **Tags (for TradingView):**
```
#TSLA #Tesla #OptionsTrading #CallOptions #BullishSetup #TSLAOptions #StockMarket #WeeklySetup #TradingStrategy #TechnicalAnalysis #TradeIdea #MomentumTrade #UnusualOptionsActivity #TradingView
$TSLA either one big flag or massive short setting upHello,
Just some browsing, NASDAQ:TSLA hasn’t had any major moves prior to early May - June IMO. This is on my watch for a short swing setup. This is bull flagging but I see a short here. I’m conflicted. I do see the higher low but we are in a pitchfork and this has been consolidating in this $290-$340 area for about a month and half. There’s also a lower high. Just posting for some free dialogue and open ideas. Talk to me. Let me know what you see and think. We aren’t too far from 200EMA and 200SMA. It’s just curling above the 50 as well. Maybe we consolidate for another week or two? A massive move is brewing here I think. I’m talking $100 in a week up or down soon.
WSL
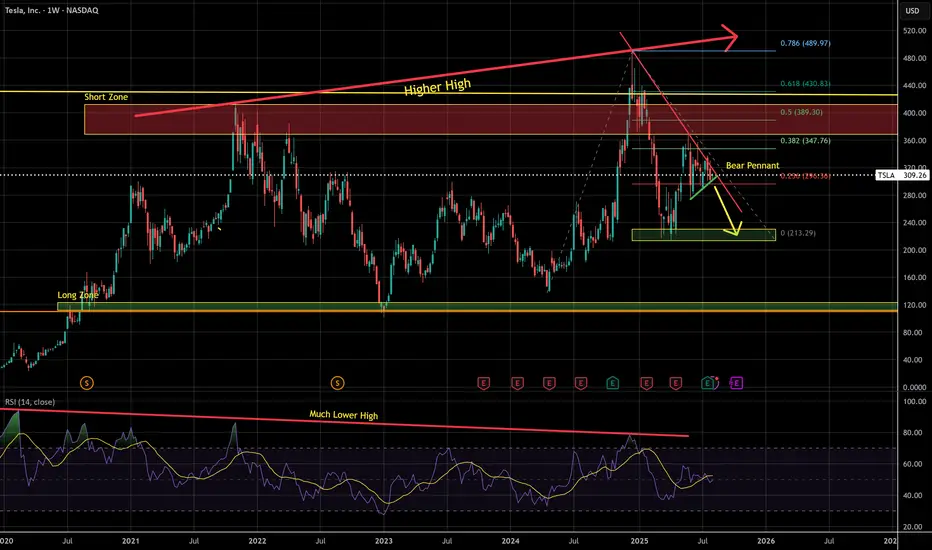
Bearish Pennant & Long Term Bearish DivergenceBearish pennant formed and sharp bearish divergence on the RSI, Elon personally receiving billions from the pockets of the company. This alludes to possible instability on the inside, despite being up a significant amount this year. Companies are like icebergs, cracks on the surface run deep, negative information is repressed.
In my opinion, a drawdown of over 25% seems in order