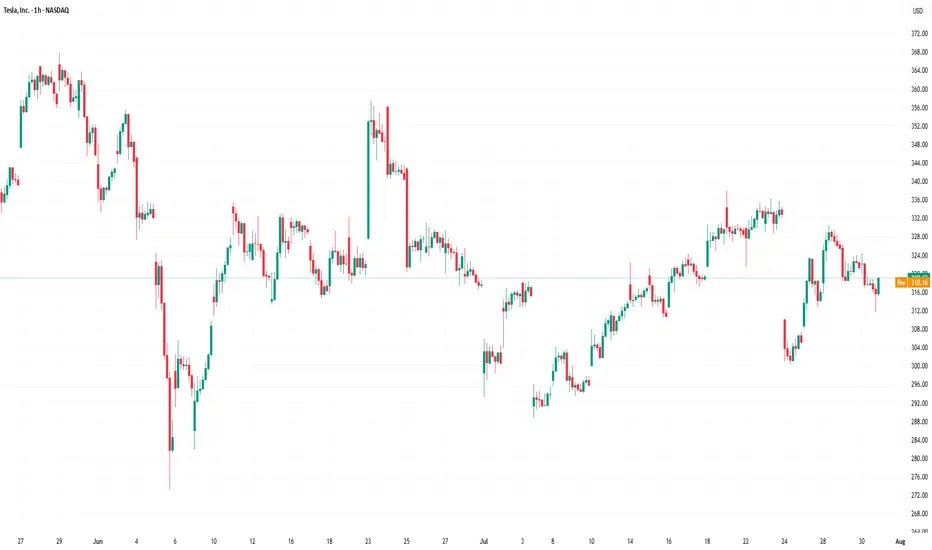
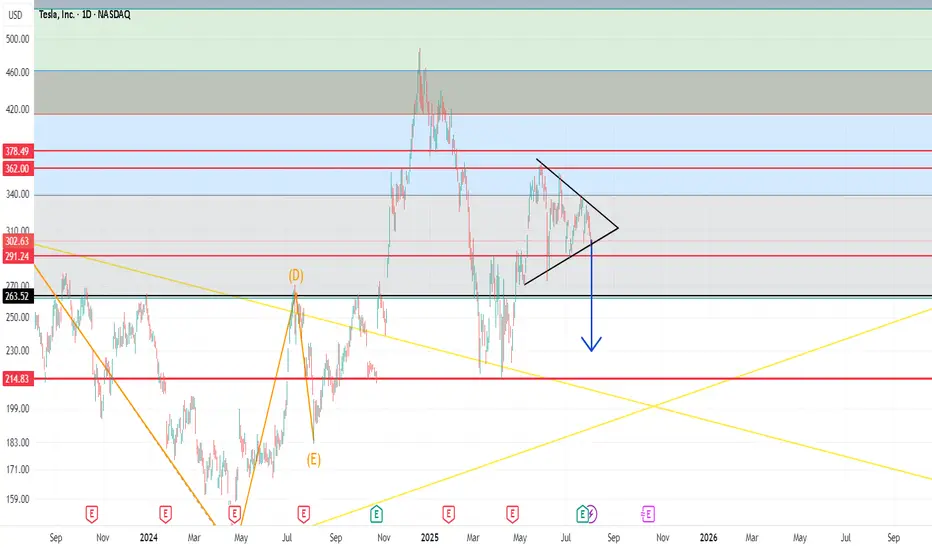
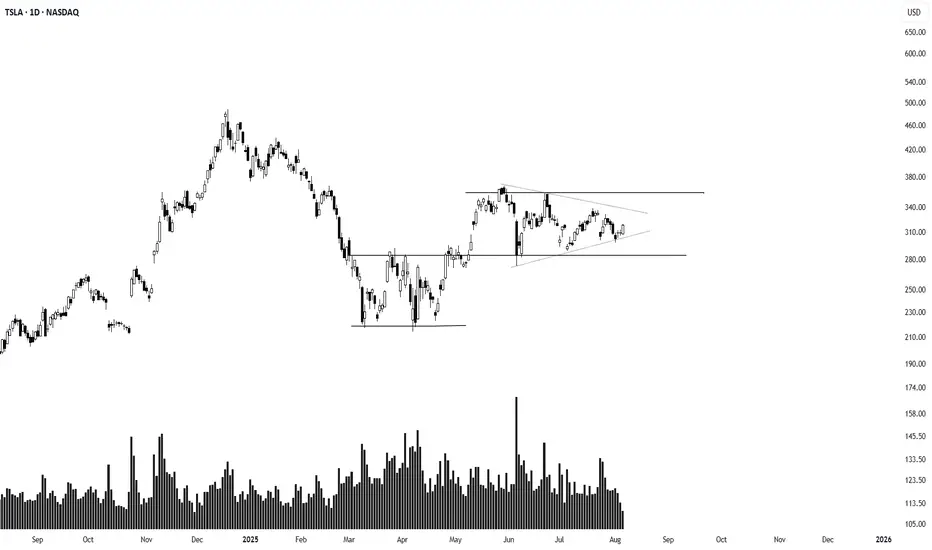
$TSLA either one big flag or massive short setting upHello,
Just some browsing, NASDAQ:TSLA hasn’t had any major moves prior to early May - June IMO. This is on my watch for a short swing setup. This is bull flagging but I see a short here. I’m conflicted. I do see the higher low but we are in a pitchfork and this has been consolidating in this $290-$340 area for about a month and half. There’s also a lower high. Just posting for some free dialogue and open ideas. Talk to me. Let me know what you see and think. We aren’t too far from 200EMA and 200SMA. It’s just curling above the 50 as well. Maybe we consolidate for another week or two? A massive move is brewing here I think. I’m talking $100 in a week up or down soon.
WSL
TSLA trade ideas
TSLA Don't Miss Out
### 🔥 TradingView Viral Post Format 🔥
---
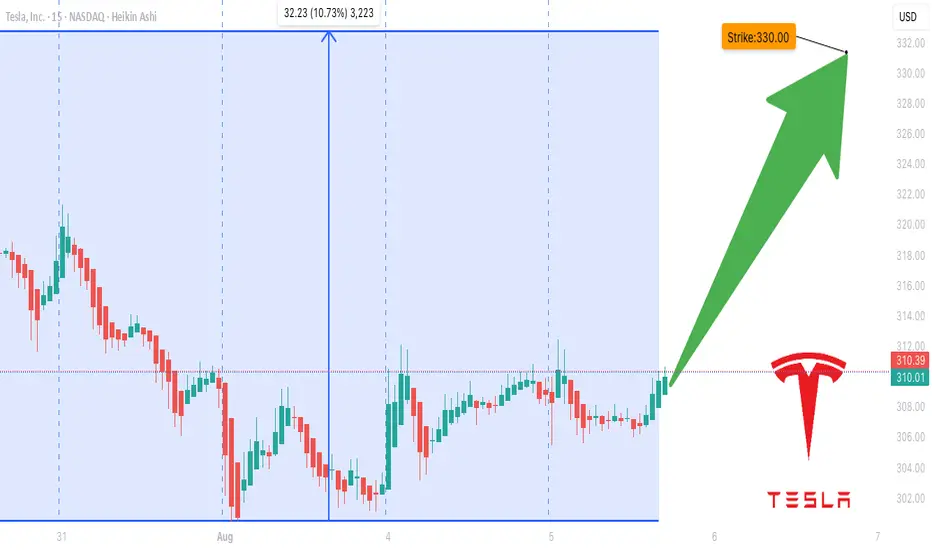
### 📢 **Title:**
**TSLA Options Surge? \$330 Call Could Double in 3 Days — Here's the Setup** 🚀📈
---
### 📝 **Description:**
Tesla’s options market is flashing **moderate bullish signals** this week! 📊
✔️ Call/Put Ratio: **1.39** (Bullish)
✔️ RSI (Daily & Weekly): **Rising**
⚠️ Volume is light, but sentiment leans bullish.
🎯 **Trade Idea:**
Buy TSLA \$330 Call (Exp: Aug 8)
💰 Entry: \$0.85
🎯 Target: \$1.70
🛑 Stop: \$0.43
⏱️ Confidence: 65%
⚡ Gamma risk rising with time decay — tight execution is key.
Is this the breakout or a bull trap? Let’s watch it play out 👀
👇 Drop your thoughts or setups in the comments!
---
### 🏷️ **Tags (for TradingView):**
```
#TSLA #Tesla #OptionsTrading #CallOptions #BullishSetup #TSLAOptions #StockMarket #WeeklySetup #TradingStrategy #TechnicalAnalysis #TradeIdea #MomentumTrade #UnusualOptionsActivity #TradingView
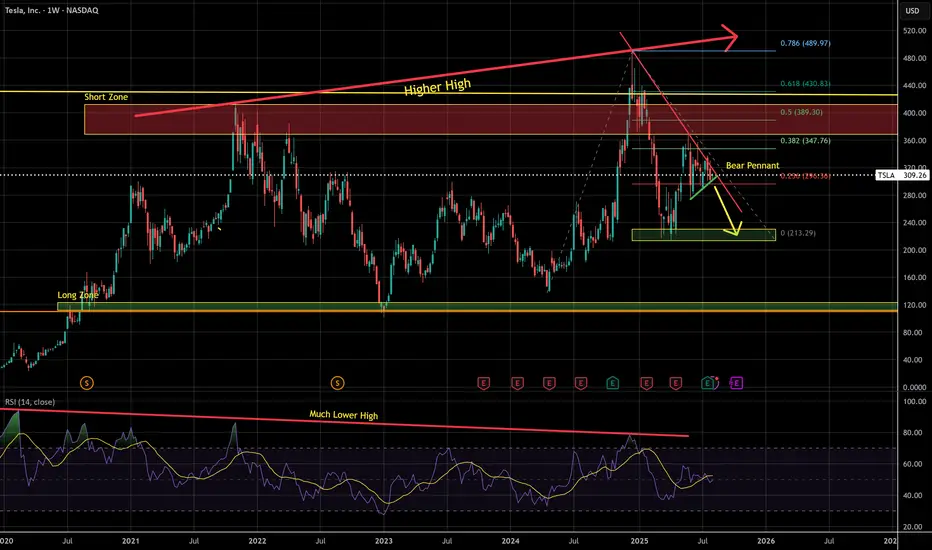
Bearish Pennant & Long Term Bearish DivergenceBearish pennant formed and sharp bearish divergence on the RSI, Elon personally receiving billions from the pockets of the company. This alludes to possible instability on the inside, despite being up a significant amount this year. Companies are like icebergs, cracks on the surface run deep, negative information is repressed.
In my opinion, a drawdown of over 25% seems in order
Fibonacci Arcs in Stock TradingFibonacci Arcs in Stock Trading
Fibonacci arcs, derived from the renowned Fibonacci sequence, offer a compelling blend of technical analysis and market psychology for traders. By mapping potential support and resistance areas through arcs drawn on stock charts, these tools provide insights into future price movements. This article delves into the practical applications of Fibonacci arcs in trading, their interplay with market psychology, and best practices for effective use.
Understanding Fibonacci Arcs
The Fibonacci arc indicator is a unique tool in technical analysis derived from the famed Fibonacci sequence. It’s crafted by drawing arcs at the key Fibonacci retracement levels - 38.2%, 50%, and 61.8% - from a high to a low point on a stock chart. Each curve represents potential support or resistance areas, offering insights into the stock’s future movements.
The art of arc reading, meaning interpreting these curves, is crucial for traders. When a stock approaches or intersects with an arc, it reflects a significant reaction level. For instance, if a stock price touches or nears an arc, it could face arc resistance, indicating a potential halt or reversal in its trend.
Applying Fibonacci Arcs in Trading
In the stock market, these arcs serve as a guide for traders seeking to anticipate future price movements. When applied correctly, they can provide critical insights into potential support and resistance levels. Here's a step-by-step look at how you may use them effectively:
- Identifying High and Low Points: Begin by selecting a significant high and low point on the stock's chart. In an uptrend, it’s the most recent swing high to a previous swing low, and vice versa. These are the anchor points.
- Drawing the Arcs: Once the points are selected, draw the arcs at the Fibonacci retracement levels of 38.2%, 50%, and 61.8%. They radiate from the chosen low point to the high point (or vice versa), cutting across the chart.
- Interpretation: Watch how the stock interacts with these lines. When the price approaches an arc, it might encounter resistance or support, signalling a potential change in trend or continuation.
- Timing Entries and Exits: Traders can use the arcs in the stock market as a tool to time their trading decisions. For instance, a bounce could be a signal to enter a trade, whereas the price breaking through might suggest it's time to exit.
Fibonacci Arcs and Market Psychology
The effectiveness of Fibonacci arcs in trading is deeply intertwined with market psychology. They tap into the collective mindset of traders, who often react predictably to certain price levels. The Fibonacci sequence, underlying this tool, is not just a mathematical concept but also a representation of natural patterns and human behaviour.
When a stock nears a curve, traders anticipate a reaction, often leading to a self-fulfilling prophecy. If many traders make an arc stock forecast, they might sell as the price approaches a certain point, causing the anticipated resistance to materialise. Similarly, seeing support at an arc can trigger buying, reinforcing the tool’s power.
This psychological aspect makes Fibonacci arcs more than just technical tools. They are reflections of the collective expectations and actions of market participants, turning abstract mathematical concepts into practical indicators of market sentiment and potential movements.
Best Practices
Incorporating Fibonacci arcs into trading strategies involves nuanced techniques for better accuracy and efficacy. Here are some best practices typically followed:
- Complementary Tools: Traders often pair this tool with other indicators like moving averages or RSI for a more robust analysis.
- Accurate Highs and Lows: It's best to carefully select the significant high and low points, as the effectiveness of the curves largely depends on these choices.
- Context Consideration: Understanding the broader market context is crucial. Traders usually use Fibonacci arcs in conjunction with fundamental factors to validate their analysis.
- Watch for Confluence: Identifying areas where Fibonacci levels converge with other technical signals can provide stronger trade setups.
- Practice Patience: Traders typically avoid making hasty decisions based solely on Fibonacci levels. It's usually better to wait to see additional confirmation from the price action.
Advantages and Limitations of Fibonacci Arcs
Fibonacci arcs are a popular tool in technical analysis, offering distinct advantages and some limitations in analysing stock movements. Understanding these can help traders leverage the tool more effectively.
Advantages
- Intuitive Nature: The Fibonacci sequence is a natural pattern, making the tool intuitive for traders to understand and apply.
- Dynamic Support and Resistance Levels: They provide dynamic levels of support and resistance, unlike static lines, adapting to changing market conditions.
- Versatility: Effective in various market conditions, the arcs can be used in both trending and sideways markets.
Limitations
- Subjectivity in Selection: The effectiveness largely depends on correctly identifying the significant high and low points, which can be subjective.
- Potential False Signals: Like all technical tools, they can generate false signals, especially in highly volatile markets.
- Requires Complementary Analysis: To maximise effectiveness, these curves are usually used alongside other technical indicators, as they are not infallible on their own.
The Bottom Line
Fibonacci arcs are invaluable tools in stock analysis, providing insights into market trends and potential price movements.
This article represents the opinion of the Companies operating under the FXOpen brand only. It is not to be construed as an offer, solicitation, or recommendation with respect to products and services provided by the Companies operating under the FXOpen brand, nor is it to be considered financial advice.
Tesla (TSLA) – VolanX Forecast: The Calm Before the Storm?📊 Tesla (TSLA) – VolanX Forecast: The Calm Before the Storm?
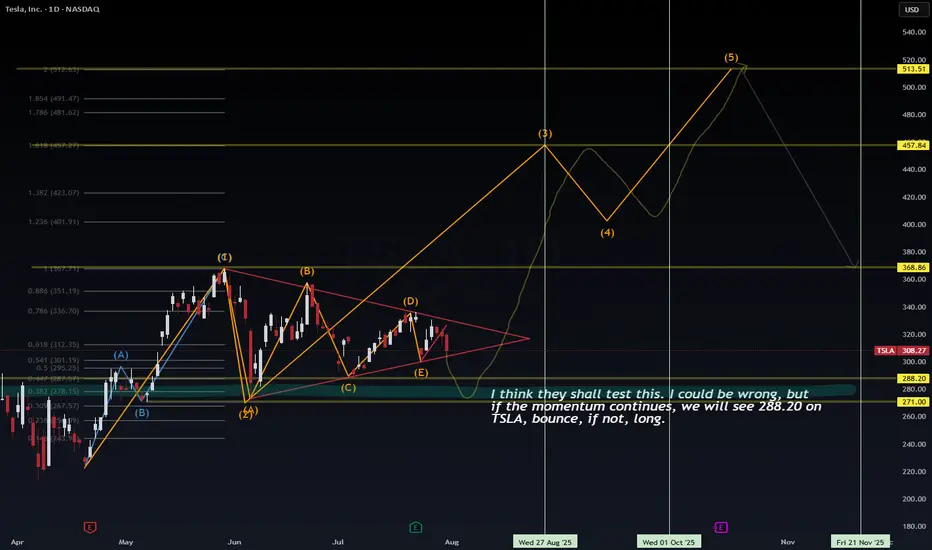
Wave structure analysis + liquidity map + roadmap to $513
🧩 The Story So Far – Compressed Potential
Tesla has spent the past three months inside a contracting triangle (ABCDE) — a classic Elliott Wave corrective pattern that signals energy compression before expansion. From the May high (Wave (1)), price has been coiling within tightening range boundaries, forming lower highs and higher lows. The triangle culminates with leg (E), now hovering near support.
🟠 VolanX flags this as a terminal wedge—an area where institutions test both sides of the book, hunting liquidity.
🌀 Wave Forecast – Impulse Awakening
If the triangle completes as expected, we enter Wave (3)—typically the most explosive wave in Elliott sequences.
Here's how the projected roadmap unfolds:
Wave (2) ends around $288.20–$271.00 (key demand/liquidity zone)
Wave (3) initiates from this springboard, aiming toward:
📈 1.0 Fib Extension at $367.71
📈 1.618 Extension at $457.84
Consolidation expected at that level forms Wave (4)
Final thrust into Wave (5) targets $513.51, aligning with extended Fib projection and historical order block
This sequence respects classical Elliott impulse structure: 5-wave motive into macro target zone.
🧪 Timing & Liquidity – Watch the Clock, Watch the Flow
🗓 Key Windows from chart verticals:
Aug 27–Sep 1, 2025: Liquidity test at $288.20 zone
Oct 1–15, 2025: Expansion toward Wave (3)
By mid-November 2025: Completion of Wave (5) → exhaustion at $513 zone before probable macro retracement
🔍 Liquidity Zones:
$288.20 – Institutional reaccumulation level (VolanX confirms large resting bids)
$271.00 – Final sweep zone. Break below would invalidate bullish count
Above, $336.70–$351.19 is the first liquidity magnet
Major stops above $457.84, then final cluster $513.51
🧠 VolanX Opinion – AI View on Risk & Opportunity
VolanX signals high-probability breakout setup, with confluence across:
Liquidity clusters
Fibonacci symmetry
Elliott sequencing
Gamma positioning (institutional hedging tilts long below $290)
📈 Current predictive bias: 68% probability of breakout from triangle resolving bullishly, conditional on $288 support holding.
If tested and respected, AI favors aggressive repositioning in long gamma, echoing historical TSLA breakout behavior.
📌 Strategy Summary:
“I think they shall test this… I could be wrong. But if momentum holds, $288.20 bounce is likely. If not, wait for structure to rebuild before long.”
🧭 Trade Setup (Not Financial Advice):
Watch zone: $288–271
Confirmation: Strong rejection wick + volume delta flip
Stop: Below $267.57
Targets: $367.71 → $457.84 → $513.51
🔻 Risk comes from invalidation below $271.
⚡ Reward stems from recognizing compression before expansion.
#TSLA #VolanX #ElliottWave #LiquiditySweep #WaveAnalysis #FibonacciLevels #SmartMoney #OptionsFlow #TeslaForecast #AITrading #WaverVanir
TSLA LONGAccumulating tesla shares - $300 is a very interesting area for TSLA, Looks like as long as we hold this area we should see $500 by end of year... much sooner.

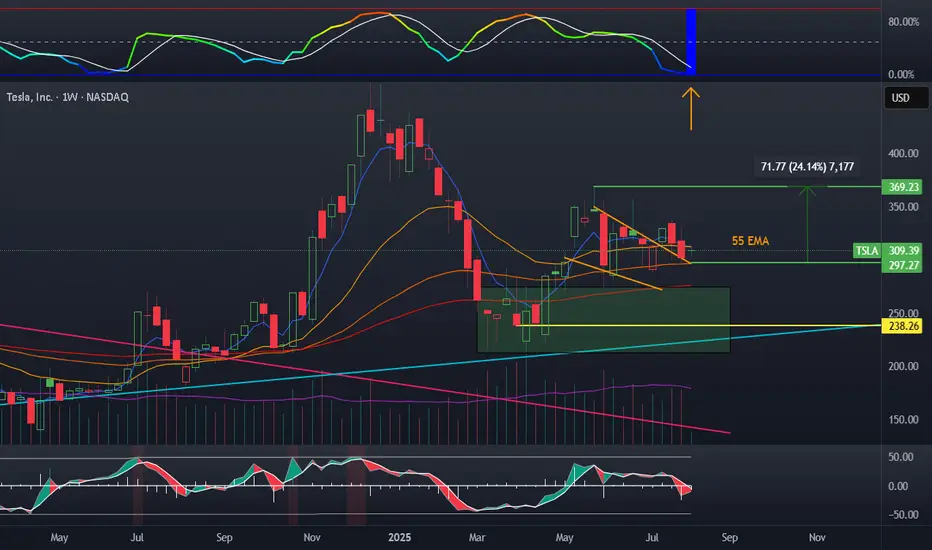
TESLA Lagging BehindA compelling reason to buy Tesla stock now—despite it being beaten down—is the asymmetric risk-reward setup driven by its depressed valuation relative to long-term growth potential. Sentiment is currently low due to concerns about EV demand, competition, and Elon’s distractions, but this pessimism is largely priced in. Meanwhile, Tesla still holds massive optionality: AI-driven autonomy, energy storage, and Dojo supercomputing. If even one of these verticals scales meaningfully, current prices may prove a generational entry.
At the moment, we are hitting some of my key support levels being the anchored vwap from the low , as well as the previous Value Area High range retest within the formation of this broader triangle, suggesting a potential continuation to the upside should we get a strong breakout.
I will be watching for further down side as the current risk is only approx 6-7% for a potential upside of 60%-70% , a massive Risk to reward.
Should this reclaim the downtrend vwap, it can be a strong sign of strength for this stock to move back to ATH's as tesla is massively lagging behind.

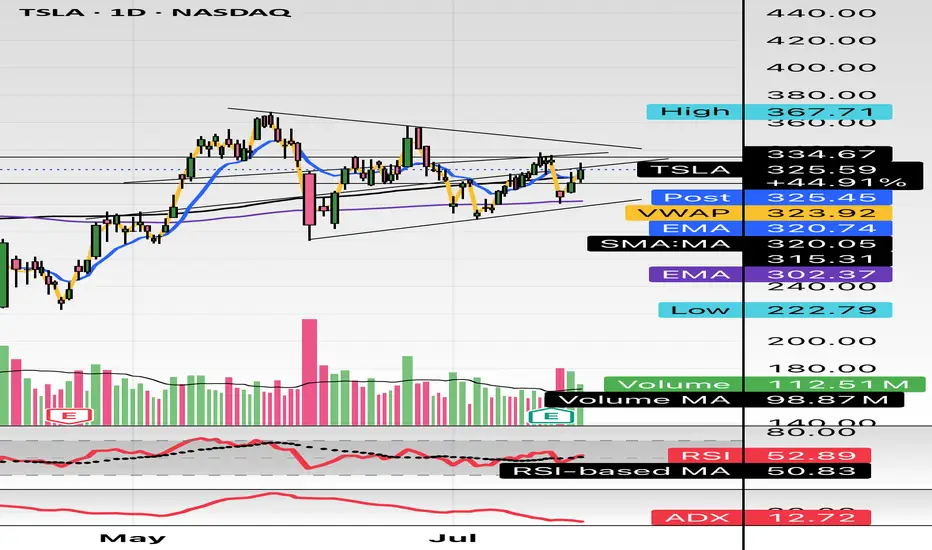
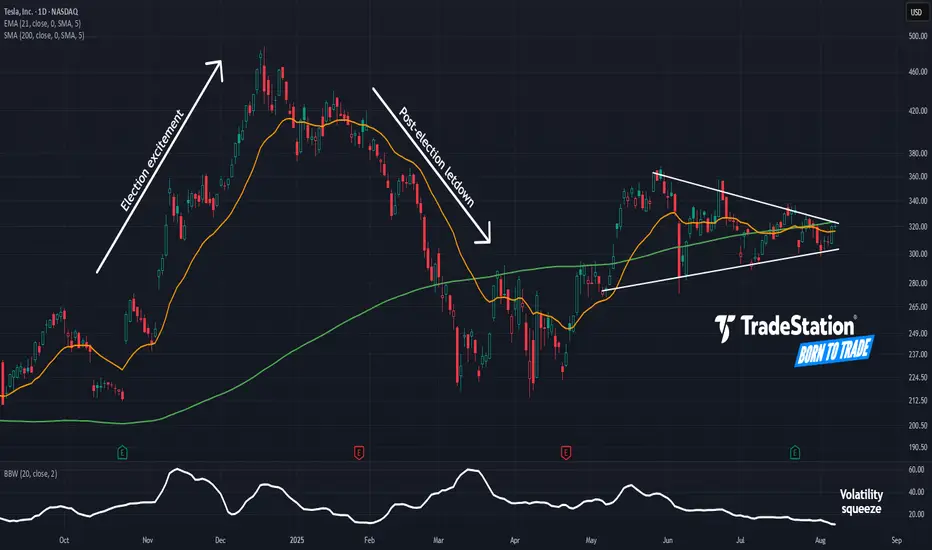
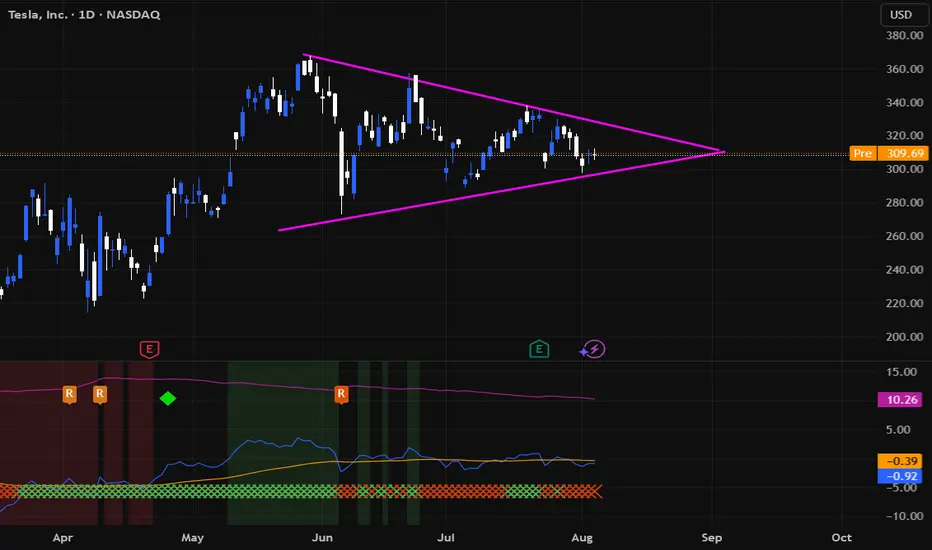
Tight Squeeze in TeslaTesla rallied sharply in late 2024, followed by a drop in the first quarter. Now, after a long period of consolidation, some traders may think the EV maker is getting ready to move again.
The first pattern on today’s chart is the series of higher lows and lower highs since May. That converging triangle may give TSLA breakout potential.
Second, Bollinger Bandwidth has squeezed to a 13-month low. Will that price compression give way to expansion?
Third, the rising 200-day simple moving average may suggest a longer-term uptrend remains in effect.
Next, prices are trying to push above the 21-day exponential moving average. That may be consistent with increasing bullishness in the short term.
Finally, TSLA is a highly active underlier in the options market. (Its average daily volume of 2.3 million contracts ranks behind only Nvidia in the S&P 500, according to TradeStation data.) That may help traders take positions with calls and puts.
TradeStation has, for decades, advanced the trading industry, providing access to stocks, options and futures. If you're born to trade, we could be for you. See our Overview for more.
Past performance, whether actual or indicated by historical tests of strategies, is no guarantee of future performance or success. There is a possibility that you may sustain a loss equal to or greater than your entire investment regardless of which asset class you trade (equities, options or futures); therefore, you should not invest or risk money that you cannot afford to lose. Online trading is not suitable for all investors. View the document titled Characteristics and Risks of Standardized Options at www.TradeStation.com . Before trading any asset class, customers must read the relevant risk disclosure statements on www.TradeStation.com . System access and trade placement and execution may be delayed or fail due to market volatility and volume, quote delays, system and software errors, Internet traffic, outages and other factors.
Securities and futures trading is offered to self-directed customers by TradeStation Securities, Inc., a broker-dealer registered with the Securities and Exchange Commission and a futures commission merchant licensed with the Commodity Futures Trading Commission). TradeStation Securities is a member of the Financial Industry Regulatory Authority, the National Futures Association, and a number of exchanges.
Options trading is not suitable for all investors. Your TradeStation Securities’ account application to trade options will be considered and approved or disapproved based on all relevant factors, including your trading experience. See www.TradeStation.com . Visit www.TradeStation.com for full details on the costs and fees associated with options.
Margin trading involves risks, and it is important that you fully understand those risks before trading on margin. The Margin Disclosure Statement outlines many of those risks, including that you can lose more funds than you deposit in your margin account; your brokerage firm can force the sale of securities in your account; your brokerage firm can sell your securities without contacting you; and you are not entitled to an extension of time on a margin call. Review the Margin Disclosure Statement at www.TradeStation.com .
TradeStation Securities, Inc. and TradeStation Technologies, Inc. are each wholly owned subsidiaries of TradeStation Group, Inc., both operating, and providing products and services, under the TradeStation brand and trademark. When applying for, or purchasing, accounts, subscriptions, products and services, it is important that you know which company you will be dealing with. Visit www.TradeStation.com for further important information explaining what this means.
WXY structure with a double topTesla has been in a uptrend with a corrective structure WXY. I am not sure if the WXY is a part of wave 5 terminal structure or a B wave. However expecting a double top or 78.6 retrace to 425-430 range as a minimum. For this scenario, an impulsive upside move is expected within the next few weeks. However the price needs to move back into the channel next week as a first step.

Tesla wedge and volatilityTesla has been riding this wedge downward after a false breakout on terrible earnings. BBWP has flashed blue, which has not happened since 2017, which is a signal for me. Stochastic has reset, and a stall candle is forming. Volume is generally up.
My plan:
TSLL shares, possible cash secured puts
Bearish Triangle: TSLAWaiting for TSLA to breakout 292 to form a bearish triangle pattern.
Target price: 22X
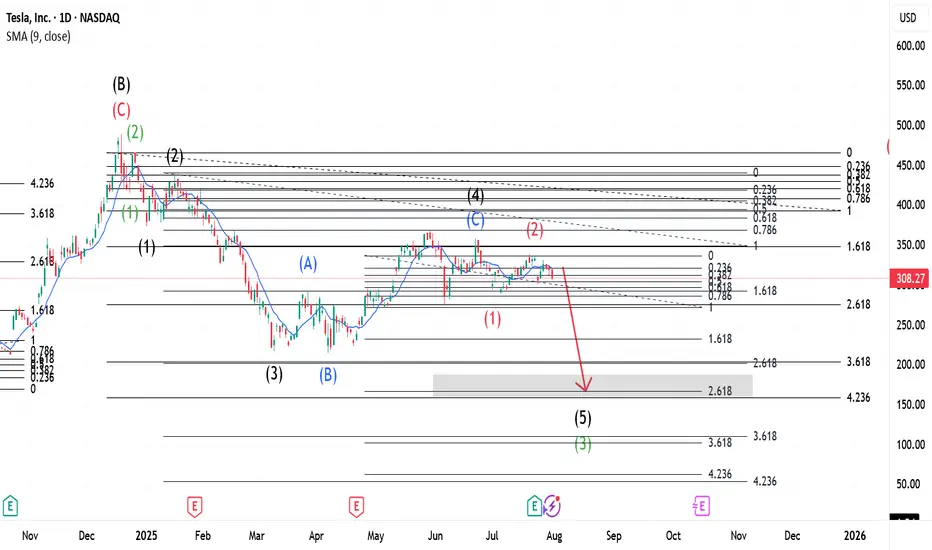
$TSLA ~ Elliott Wave Updates.This whole wave is Wave C(Black) that started when Wave B(Black) was completed. This Wave C(Black) expresses itself in 5 main waves shown in Green. Wave 2(Green) was a Zigzag and a Flat should be expected for 4(Green). Meanwhile, Wave 3(Green) expresses itself in a 5 wave move shown in Black- with Wave 2(Black) being a Zigzag, our 4 was a Flat. This Flat is shown as Blue ABC. When Wave 4(Black) completed, our Wave 5 began which upon completion, would be Wave 3(Green) of the main wave. Wave 2(Red) is a Flat and a Zigzag should be expected after 3(Red).
Go to for more information of the same.
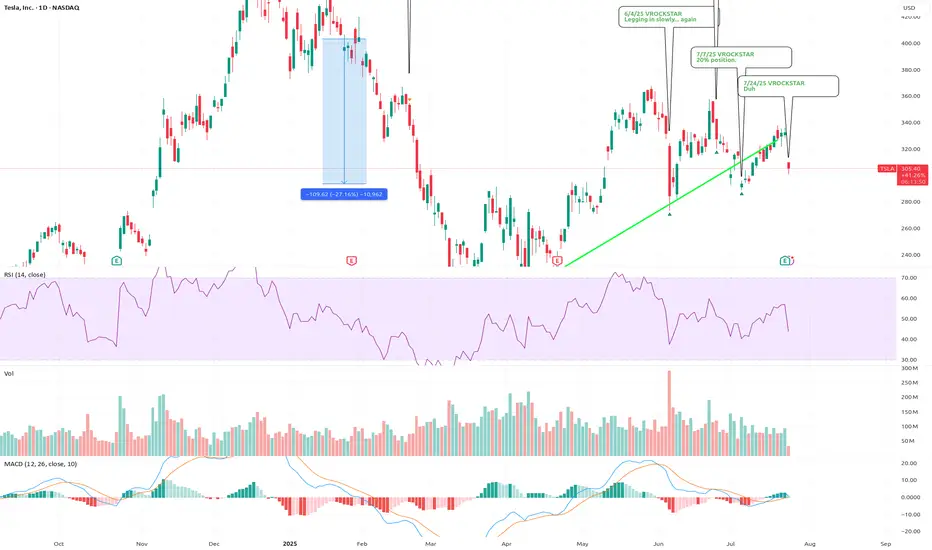
7/24/25 - $tsla - Duh 7/24/25 :: VROCKSTAR :: NASDAQ:TSLA
Duh
- ppl focused on ST FCF (all over X!) is 100% of the reason why when you put the pieces together, you realize that while ST this might not behave like anyone expects... LT, TSLA is v likely going to in, elon's own words, be the largest cap in the history of capital markets
- two leading robots with leadership position in IRL AI
- profitable, is all that matters
- have not yet hit the S-curve
was super lucky to trim some of this last week
now i'm back to sizing into a full position, not yet there like on that silly political dump, but i'm nearly 10% (20% is my max size).
V
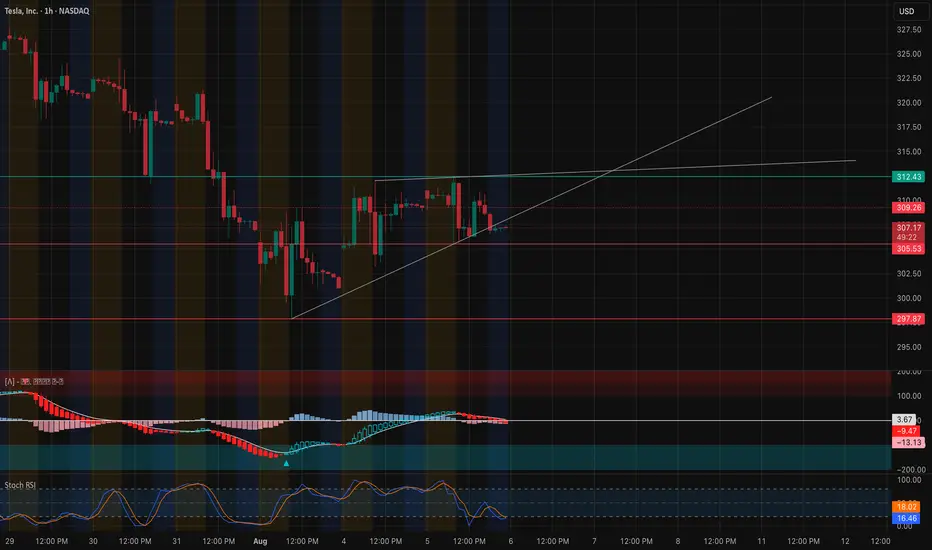
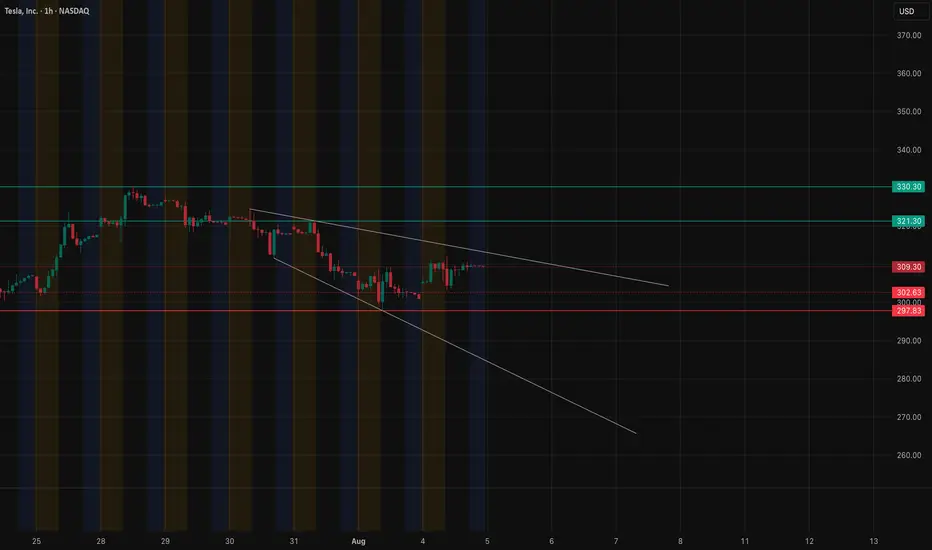
TSLA Attempting Breakout – Watching $312 Key Level. Aug. 5TSLA Attempting Breakout – Watching $312 Key Level 🚀
Technical Overview (1H)
TSLA is consolidating just below the critical $312 resistance, aligning with the Highest Positive GEX and 2nd Call Wall (57.55%). A breakout above this level could trigger a gamma squeeze toward $317.5 and potentially $325.
Support sits at $300 (Major Put Support -58.42%). If this fails, bears could push toward $295 and $290. Price is currently forming a falling wedge, a bullish reversal pattern if confirmed.
GEX & Options Flow Insights
* Highest Positive GEX: $312 – Strong resistance; breaking above can fuel upside momentum.
* Major Call Walls: $317.5, $325 – Profit-taking zones for bulls.
* Major Put Support: $300 – Bears will defend here; losing it invites heavier selling.
* Call/Put Positioning: CALLs 31.3% vs Puts – Skew still leans slightly bullish, but gamma flip is near $300.
My Thoughts
TSLA is coiling for a potential move. As long as price holds above $300, the risk/reward still favors a bullish breakout play. However, failure to clear $312 could see a pullback into $305–$300 range before another attempt.
Trade Ideas
Bullish Scenario:
* Entry: On a breakout above $312 with strong volume
* Targets: $317.5 → $325
* Stop-Loss: Below $305
Bearish Scenario:
* Entry: Rejection at $312 and loss of $305
* Targets: $300 → $295
* Stop-Loss: Above $315
15-Minute Short-Term Setup
* Intraday traders should watch for a mini breakout retest above $310 for scalps to $312+.
* If $307 fails intraday, momentum could stall toward $304–$302.
Disclaimer: This analysis is for educational purposes only and does not constitute financial advice. Always do your own research and manage your risk before trading.
TSLA Weekly Bearish Play — August 2, 2025
🔻 **TSLA Weekly Bearish Play — August 2, 2025** 🔻
🚨 **Multi-Model Consensus Signals a Tactical Put Opportunity**
### 🔍 Market Snapshot:
* **Daily RSI:** 39.9 (Bearish)
* **Weekly RSI:** 53.2 → Falling
* **Volume:** Weak (0.8x last week)
* **Options Flow:** Neutral (C/P Ratio \~1.04)
* **VIX:** 20.38 → Favorable for Options Plays
* **Institutional Support:** Weak
---
### 🔮 Model Consensus:
📉 **All major models (xAI, Google, Claude, Meta, DeepSeek)** confirm:
* Bearish momentum on both daily + weekly RSI
* Weak volume = cautious institutional behavior
* Volatility setup perfect for short-dated puts
---
### 🎯 Viral Trade Setup:
**💥 Trade Type:** PUT (Short TSLA)
**🔻 Strike:** \$300
**📆 Expiry:** 2025-08-08
**💰 Entry Price:** \$6.65
**🎯 Target Exit:** \$10.64 – \$13.30 (60%-100% gain)
**🛑 Stop Loss:** \$3.99
**📊 Confidence:** 65%
**📍 Entry Timing:** Monday open
**🕒 Signal Timestamp:** 2025-08-03 01:33:56 EDT
---
### ⚠️ Key Levels:
* Support to watch: **\$297.82**
* News/event risks: Stay alert ⚡
* Use tight risk controls for weekly plays!
---
🔥 **If you trade TSLA — don’t sleep on this one.**
Bearish consensus + clean setup = **high-probability weekly play.**

TESLA: Bullish Continuation & Long Trade
TESLA
- Classic bullish setup
- Our team expects bullish continuation
SUGGESTED TRADE:
Swing Trade
Long TESLA
Entry Point - 302.63
Stop Loss - 296.98
Take Profit - 312.87
Our Risk - 1%
Start protection of your profits from lower levels
Disclosure: I am part of Trade Nation's Influencer program and receive a monthly fee for using their TradingView charts in my analysis.
❤️ Please, support our work with like & comment! ❤️


Sitting Right on the 200-Day EMATSLA is sitting right on the 200-Day EMA here while holding this wedge for quite some time. TSLA's Bollinger Bands are starting to squeeze, indicating a significant move is forthcoming, and moving averages (MA 5/10/30/60) are flattening, indicating a loss of bullish momentum. It will be interesting to watch from here.

Tesla Forming an ApexTesla is tightening up into an Apex formation. We are seeing volume spikes at the lows which could signal a breakout to the upside, but still need confirmation of this.
TSLA Breaking Out — But Can It Hold Above $320? Aug. 7📊 Technical Analysis (1H + 15-Min Confluence)
TSLA has surged out of its $308–$312 consolidation range with strong bullish momentum. It's now pressing against the key resistance zone just under $320, with clean price structure and a rising trendline.
* Trend: Higher lows with a breakout above structure = bullish continuation bias
* MACD: Bullish crossover + expanding histogram = momentum building
* Stoch RSI: Overbought at 88+ = short-term cooling possible, but not a sell signal on its own
* Volume: Strong breakout volume confirms interest — now needs follow-through above $320
Key Levels to Watch:
* Support Zones:
* $317.50 (micro support)
* $312.35 (breakout base / trendline confluence)
* $308.72 (former top of range)
* Resistance Zones:
* $319.85 (current high)
* $322.50 (major gamma wall)
* $325 → $330.39 (stacked supply above)
Scalping Setup (15-Min View):
* Entry (CALLs): Break and hold above $320
* Target: $322.50 then $325
* Stop: Below $317.50
* Bias: Momentum continuation as long as price holds trendline + VWAP
🔬 GEX-Based Option Sentiment (1H GEX Map)
The options market is now showing significant gamma resistance overhead, making this a crucial inflection zone:
* CALL Walls:
* $319.85 = 2nd CALL Wall (95.21%) — this is where price is currently pausing
* $322.50 = 3rd CALL Wall (86.55%)
* $325–$330 = GEX10/GEX7 cluster — potential fade zone
* PUT Support:
* $305 = HVL + strong buyer interest
* $300 = -26.58% PUT Wall
* $297.83 = 3rd PUT Wall — major dealer de-hedging zone
* Net GEX Bias:
* Positive GEX above $312.50 → bullish momentum slows as dealers hedge
* Below $305 = faster downside risk (gamma unwind)
* IVR 5.5, IVx Avg 51.4 → IV drop = favorable for buying options, not selling them
🎯 Options Trade Ideas:
* Bullish Swing (Speculative Breakout):
* Entry: Break > $322.50
* Target: $325 / $330
* Stop: < $317.5
* Bearish Fade (Gamma Cap Reversal):
* Entry: Reject below $320 with stalling momentum
* Target: $312.5 / $308
* Stop: Close > $322.5
⚠️ My Thoughts:
TSLA is at a key gamma inflection point. Price structure supports more upside, but dealer positioning above $322.5 may cap momentum unless volume forces a squeeze. Use trendline and VWAP confluence as your confirmation anchors — and watch for failed breakout traps into overhead gamma zones.
This analysis is for educational purposes only and does not constitute financial advice. Always do your own research and manage your risk before trading.

TSLA, Beyond the candlesTSLA has been printing back-to-back bounce signals, with higher lows forming consistently.
Hoping this leads to a sustained uptrend.

Leave your comment about TESLATesla is in a flag pattern on the daily time frame and I think there is fire under the ashes! Breaking the upper side of the triangle is good news for its holders.
TSLA – Testing Key Gamma & Structure Levels. TA for Aug. 6TSLA – Testing Key Gamma & Structure Levels
Technical Overview
TSLA has been consolidating just under a key resistance zone at 310–312, which also aligns with the highest positive GEX / gamma resistance area. Price is forming a higher-low structure off the 303–305 support trendline, suggesting buyers are still defending key levels despite recent selling pressure.
MACD is flattening out and Stoch RSI is cycling near mid-range, indicating a potential momentum build but no confirmed breakout yet.
GEX / Options Sentiment
* Gamma Resistance: Heavy call wall at 312 with 52% concentration, and further stacked resistance into 320–325. This creates a ceiling unless strong bullish momentum steps in.
* Gamma Support: Large put positioning at 300 (-64% concentration) and 295 acting as a key defensive floor.
* Dealer Positioning: Above 312, gamma flip could drive momentum toward 320–325 quickly. Below 300, dealer hedging could accelerate selling into 295 and possibly 290.
Trade Scenarios
Bullish Case
* Trigger: Break & hold above 312 with volume.
* Target 1: 320
* Target 2: 325
* Stop: <305
Bearish Case
* Trigger: Close below 300 with momentum.
* Target 1: 295
* Target 2: 290
* Stop: >312
Options Thoughts
* Bullish: Consider short-term calls if price breaks above 312 with strong volume and momentum confirmation.
* Bearish: Consider puts targeting 300 if rejection occurs at 310–312 and sellers regain control.
* Neutral / Premium Selling: Selling an iron condor around 295–325 could work if expecting continued range trading until a catalyst emerges.
📌 My Take: TSLA is coiling for a decisive move. GEX shows a tight battle between 312 call resistance and 300 put support. A break in either direction could lead to a fast expansion move. I’m leaning neutral-to-bullish as long as 305 holds, but I’ll switch bearish if 300 breaks.
Disclaimer: This analysis is for educational purposes only and not financial advice. Always do your own research and manage risk accordingly.